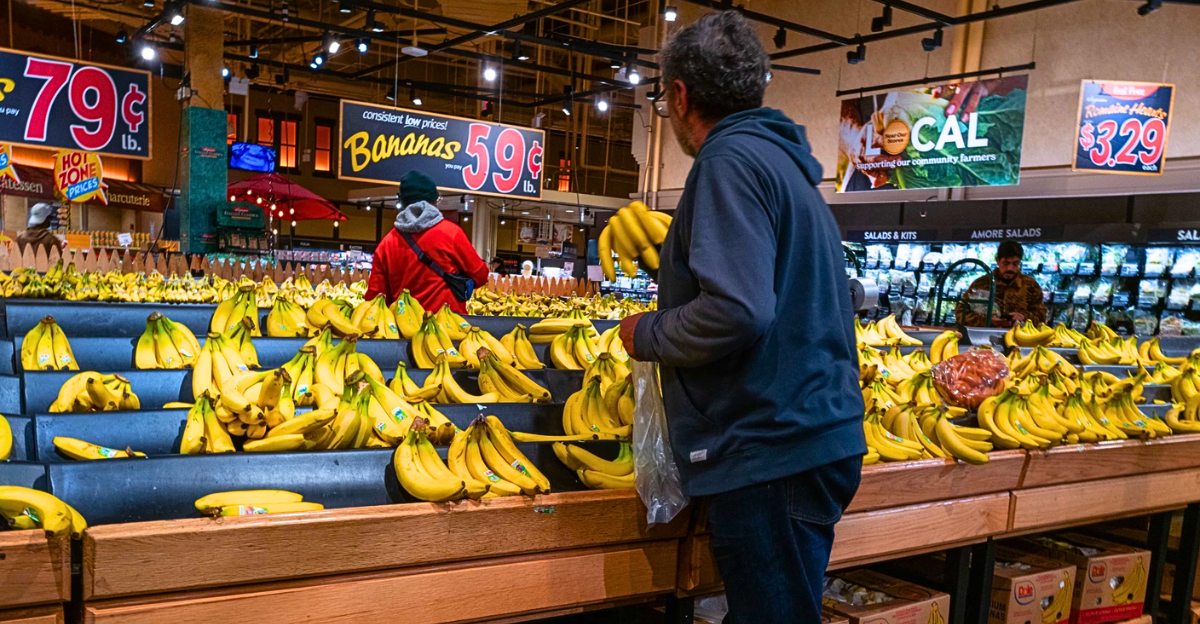
Over 41 million people in the U.S. rely on food stamps each month. Behind that number are working parents, seniors, and kids in both cities and rural areas. Hunger doesn’t always look like we expect. This list highlights the ten states where food assistance is most common, and what those numbers really mean. You might be surprised by which states top the list and why. Let’s start with how the program works.
What SNAP Actually Covers (And Who Uses It)
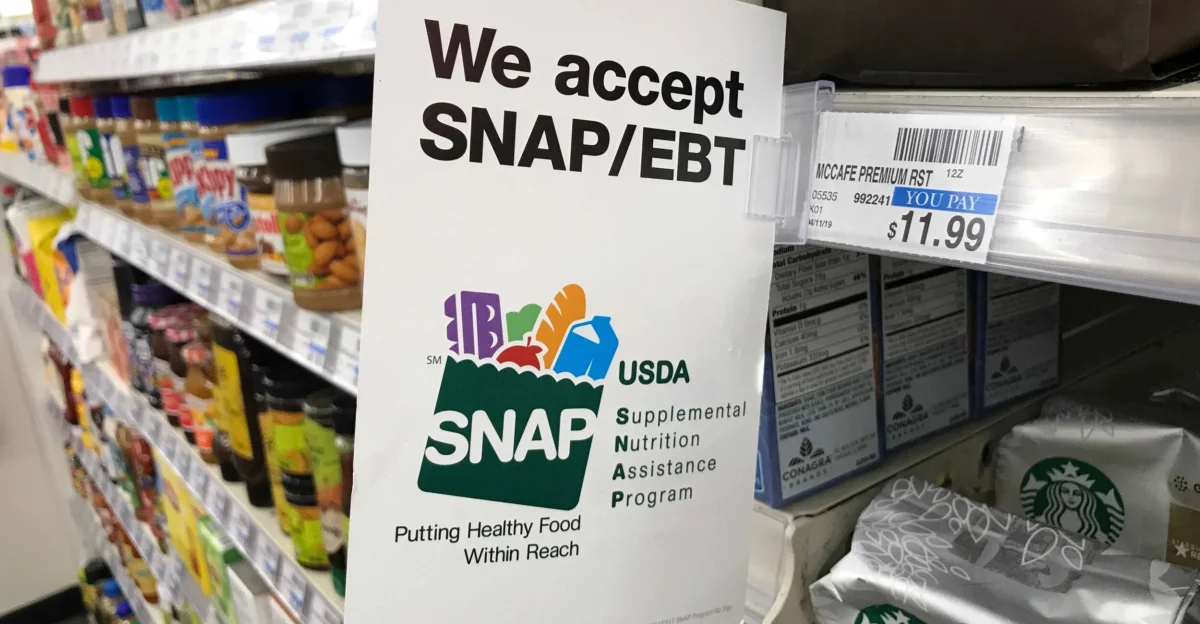
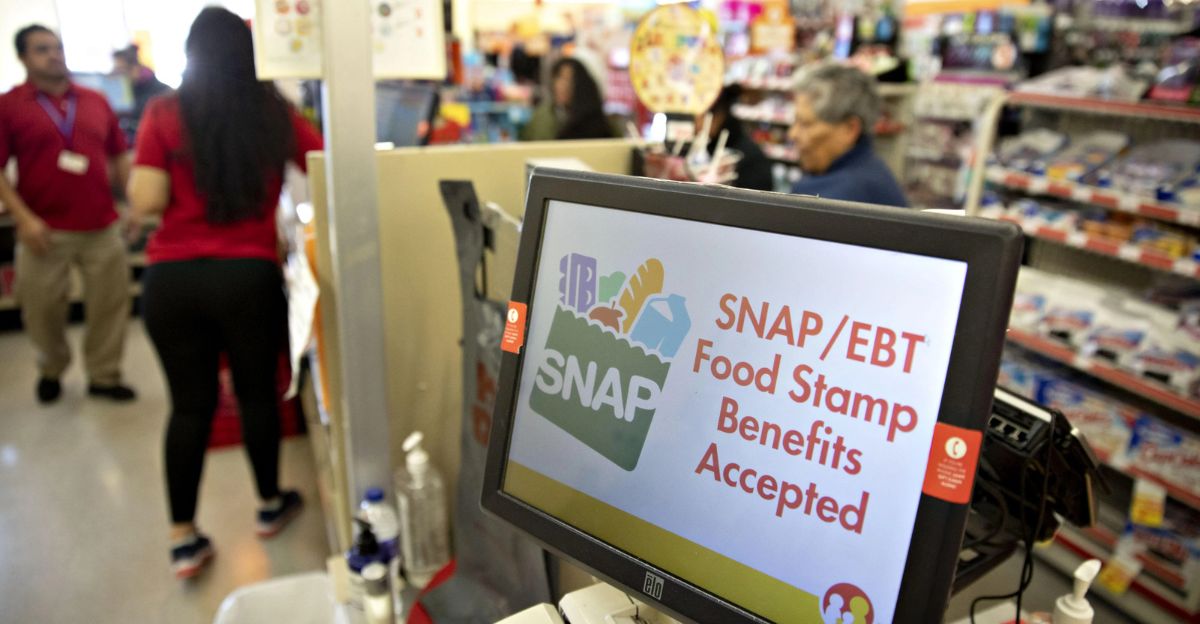
SNAP helps low-income families buy groceries using benefit cards accepted at approved stores. According to the USDA, 86% of benefits go to households with a child, senior, or person with disabilities. While 28% of all SNAP households report earned income, that figure rises to 55% in homes with children. With an average of $187 per person monthly (about $6.24 per day), this modest support plays a vital role.
Why Percentage Tells a More Honest Story
Looking at total recipients doesn’t always reveal which states depend most on food stamps. California, for instance, has over 5.4 million SNAP users, but that’s just 13.6% of its population. In contrast, New Mexico’s 451,200 recipients make up 21.2% of its residents. According to the USDA and U.S. Census Bureau, percentage of population is the better measure of true reliance. Let’s count down the ten states with the highest participation rates.
#10: Pennsylvania
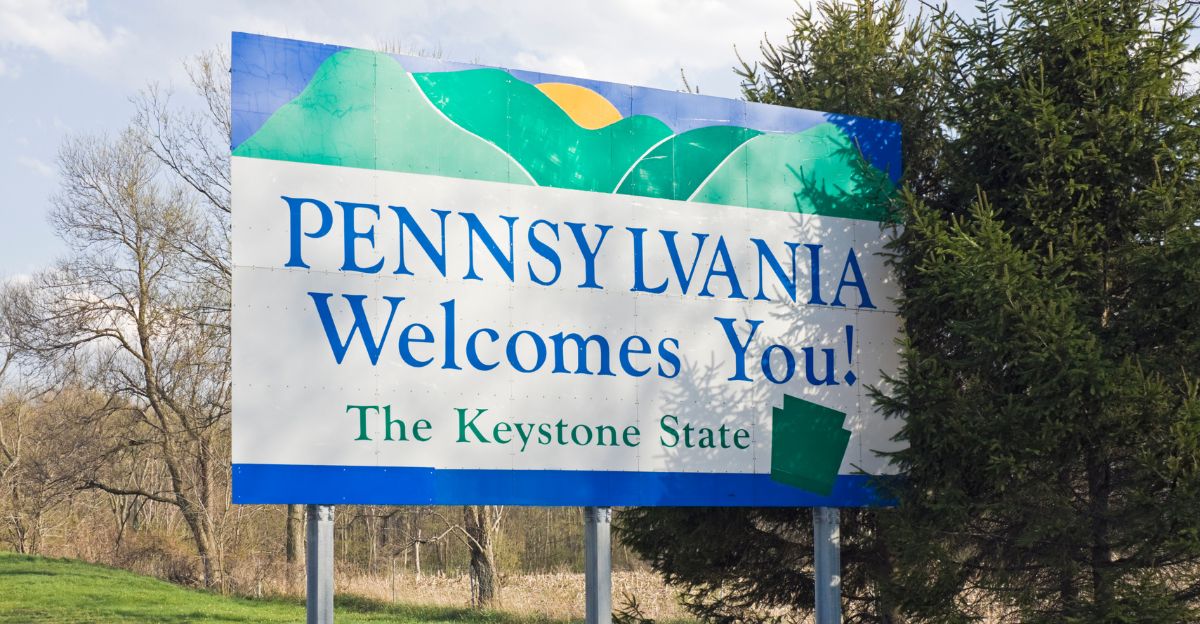
With 14.9% of residents on SNAP in FY 2023, nearly 2 million Pennsylvanians rely on food assistance. Rural areas see especially high need as the economy shifts from manufacturing to services. According to USDA data, 28% of SNAP households nationwide include someone who works. Every $1 in SNAP generates $1.54 in local economic activity. Next, we head west to a very different economy.
#9: Nevada
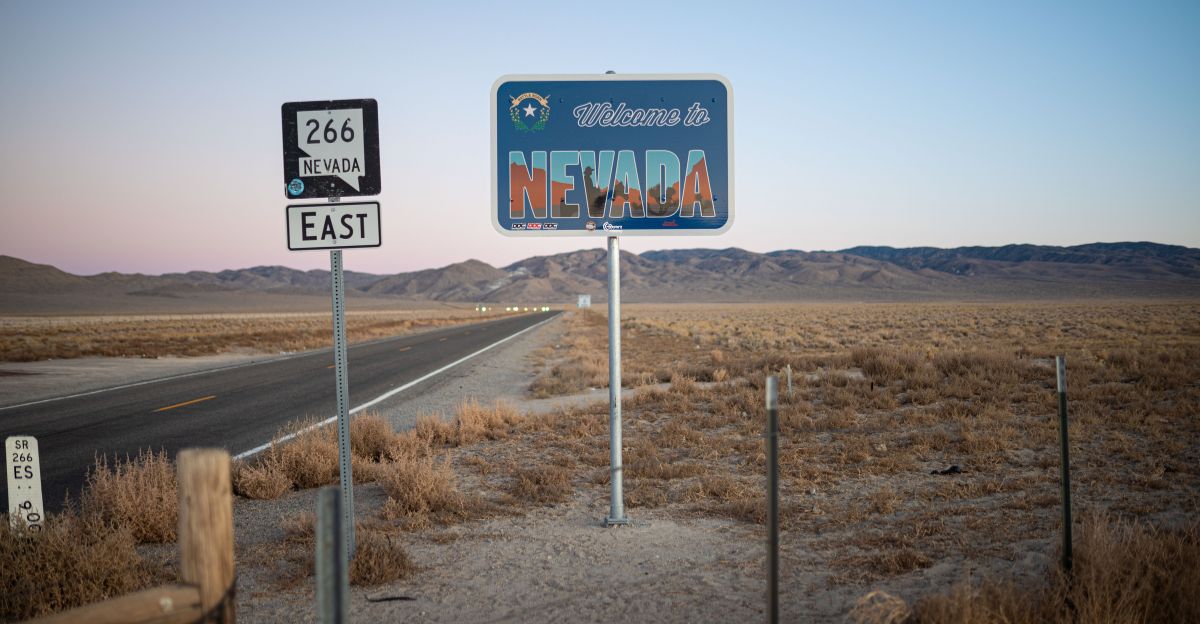
Nevada’s 15.4% SNAP rate reflects the instability of a tourism-heavy economy. Over 500,000 people depend on SNAP monthly, many in households with working adults. Jobs tied to hospitality and casinos often come with low wages and inconsistent hours. According to the USDA, 55% of SNAP households with children also report earned income. Now we head south, where rural hunger runs deep.
#8: Mississippi
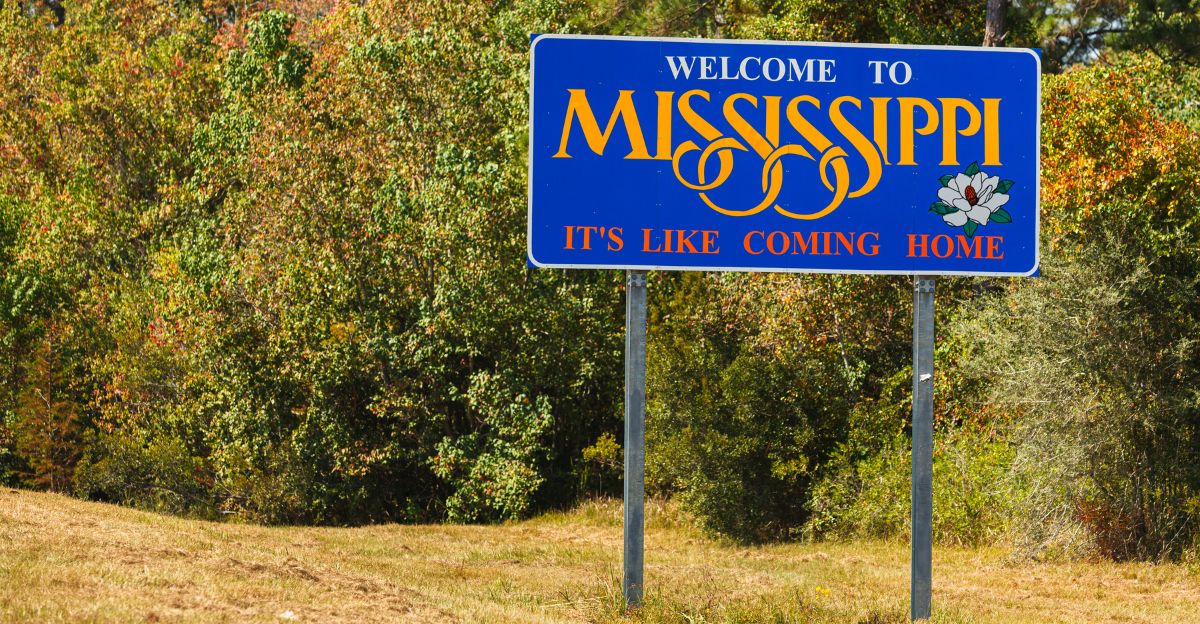
Mississippi’s 13.6% SNAP rate reflects persistent poverty, frequent disasters, and limited job access. Rural areas face added barriers, long distances to stores, unreliable transport, and fewer jobs. The state shows how geography worsens food insecurity. SNAP remains a vital lifeline for families facing both chronic hardship and climate-related setbacks. Next, a small state with an outsized need.
#7: Rhode Island

Despite being the smallest U.S. state, Rhode Island has a 13.0% SNAP rate. High housing costs and limited land drive living expenses up, forcing tough choices between food and rent. Seasonal tourism jobs add instability. Here, even a small population feels a big economic strain. Now to New York, where high wages don’t always mean food security.
#6: New York
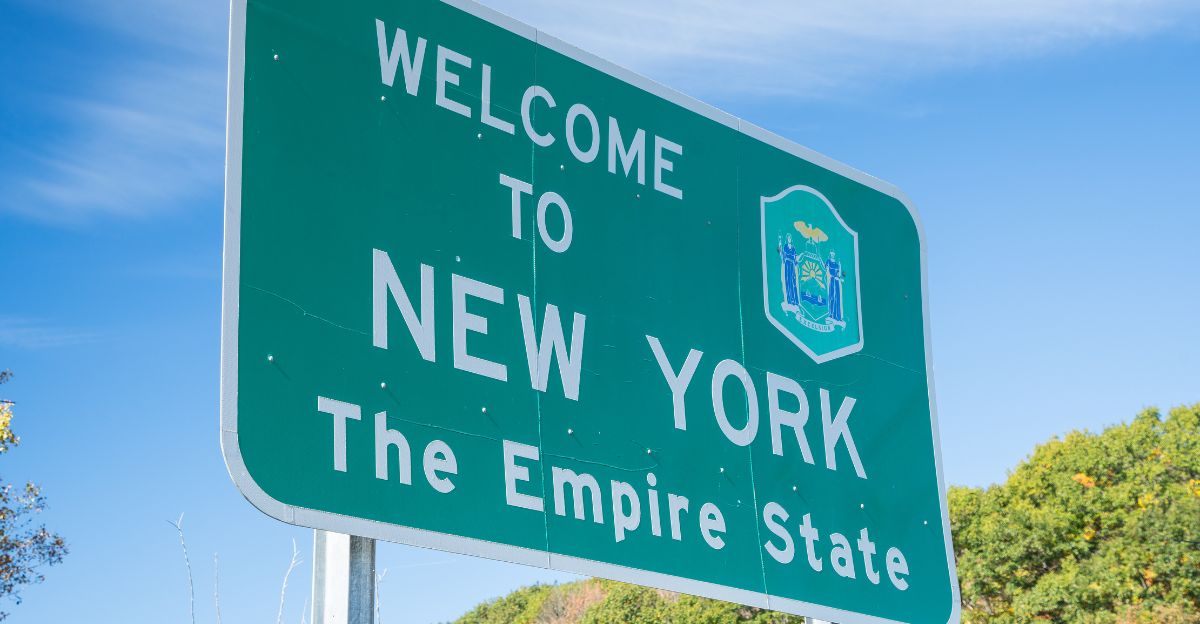
With 14.7% of residents—nearly 3 million people—on SNAP, New York proves that high incomes can’t always keep up with high costs. Urban and rural families alike struggle to cover housing, groceries, and transportation. Affordability, not just wages, drives the need for assistance. Next, Illinois shows how strong systems can boost support where it’s needed.
#5: Illinois
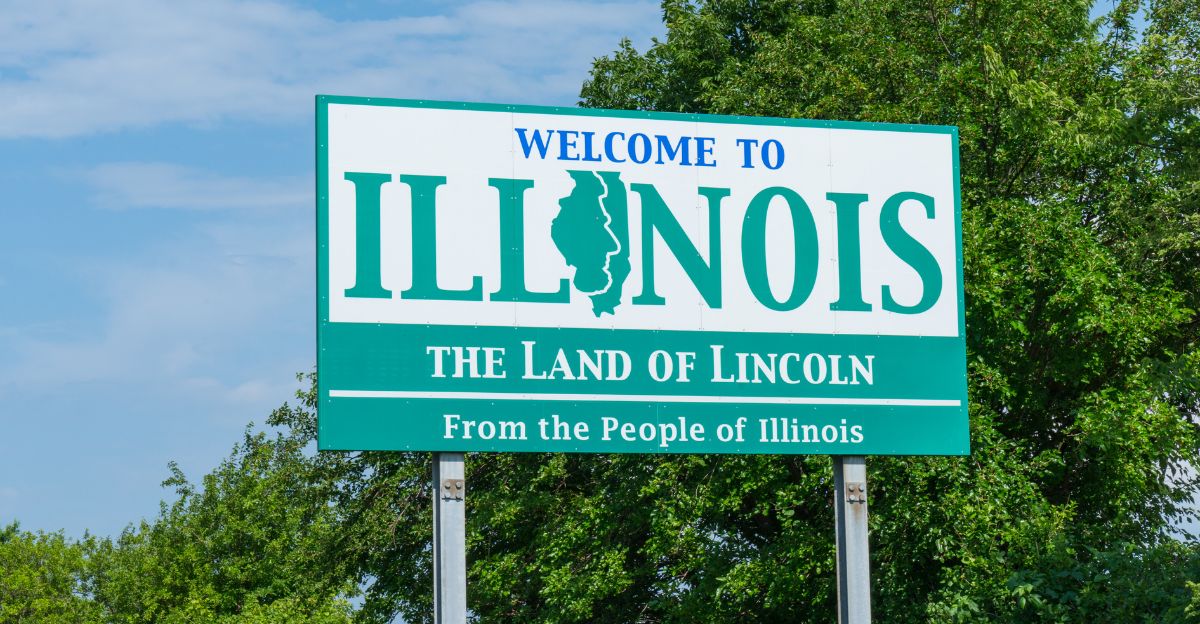
Illinois serves 16.2% of its population with SNAP, reaching nearly 2 million monthly. The state’s success lies in effective outreach and simplified enrollment, showing that administration matters as much as economics. Urban and rural regions face different challenges, but Illinois demonstrates that smart policy can bridge those gaps. Next, we head northwest to a state revealing hidden hunger.
#4: Oregon
Oregon’s 17.3% SNAP rate reflects not just need, but also strong outreach. Programs like job training and farmers market incentives help uncover food insecurity in overlooked communities. Though not among the poorest states, Oregon’s high housing costs stretch budgets thin. Active social services expose needs that might stay hidden elsewhere. Now we move to Appalachia, where old economies leave lasting marks.
#3: West Virginia
At 17.4%, West Virginia has one of the country’s highest SNAP participation rates. As coal declines and new industries lag behind, families turn to SNAP amid job shortages, transportation gaps, and limited access to stores. The state’s rural geography magnifies these struggles. Up next, a Gulf Coast state hit hard by nature and economics.
#2: Louisiana

Louisiana’s 19.6% SNAP rate highlights deep-rooted economic challenges, made worse by hurricanes, flooding, and unstable employment in oil, tourism, and agriculture. Infrastructure gaps in rural areas further hinder food access. Natural disasters and economic volatility make food assistance a critical resource. At the top of the list, one state faces all these pressures, and more.
#1: New Mexico
New Mexico leads the nation with 21.2% of residents on SNAP in FY 2024. The third-highest poverty rate, geographic isolation, and high Indigenous population contribute to widespread need. Many Native American communities face long distances to grocery stores and limited transportation. Cultural, economic, and logistical barriers compound the challenge, making SNAP essential. Now, let’s look at the opposite end of the spectrum.
States Where SNAP Is Least Needed
Utah leads with the lowest SNAP use at 4.8%, followed by Wyoming (5.1%), New Hampshire (5.3%), North Dakota (5.8%), and Idaho (6.3%). These states often benefit from strong economies, lower costs of living, and tight-knit community support systems. Prosperity in sectors like energy and tech also helps reduce food insecurity. Finally, let’s reflect on what these figures really mean.
What These Numbers Really Mean About America
SNAP statistics reveal more than who needs help, they highlight wage gaps, cost of living, economic resilience, and policy success. From urban centers to rural outposts, food aid touches all corners of America. Every $1 spent generates $1.54 in economic growth. Behind each number is a real person, a working parent, a senior, a child, depending on SNAP while communities work to create lasting solutions.