
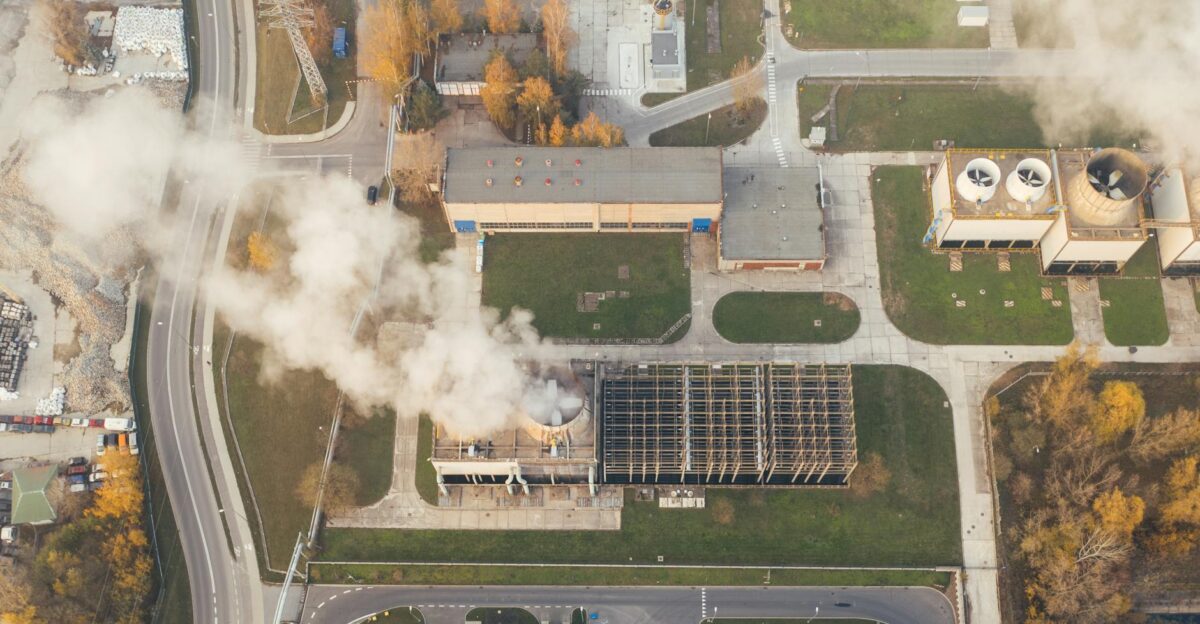
Decades, national pollution averages masked the true scope of carbon dioxide emissions, hiding dangers from nearby factories, highways, and power plants. Now, a new dataset offers unprecedented visibility into local CO₂ hotspots across the entire United States, arriving just as federal reporting requirements face elimination.
Nationwide Coverage at Unprecedented Resolution

Kevin Gurney, an atmospheric scientist at Northern Arizona University, began piecing together this puzzle in 2004 with his Vulcan project. Initially a proof-of-concept, it aimed to trace fossil fuel carbon burning down to the street-block level. Early versions were rudimentary, but by 2024, refinements made it scalable. Vulcan v4.0, released on December 16, 2025, covers 13 years from 2010 to 2022, providing emissions data for all 50 states. The continental U.S. and Alaska feature one-kilometer grid resolution mapping, while Hawaii data is available in aggregated form upon request. The dataset pinpoints emissions from power plants, vehicles, buildings, and cement factories, with extensive data files available on the public repository Zenodo.
The EPA’s Rollback Threat

This launch coincides with a pivotal regulatory shift. In September 2025, the Environmental Protection Agency proposed ending its Greenhouse Gas Reporting Program, a rule mandating annual disclosures from about 8,000 large facilities emitting over 25,000 metric tons of CO₂ yearly. Power plants, refineries, and cement producers would no longer report publicly, creating a data vacuum. Vulcan steps in as independent science counters this retreat, though its updates rely on fragmented sources without mandatory facility inputs.
What Residents Now See
For the first time, residents across all 50 states can access annual CO₂ emissions data at unprecedented detail. In the continental U.S. and Alaska, anyone can examine emissions for their Census block. Neighborhoods near highways reveal elevated road-transport figures. Blocks downwind from coal plants show industrial spikes. Schools in factory zones now have quantifiable pollution profiles. The high-resolution dataset spans hundreds of terabytes across over 8 million grid cells, detailing thousands of facilities and hundreds of thousands of road segments. Yet, its scale demands high-performance computing for full analysis, limiting casual use without specialized tools.
Geographic Scope and Global Context
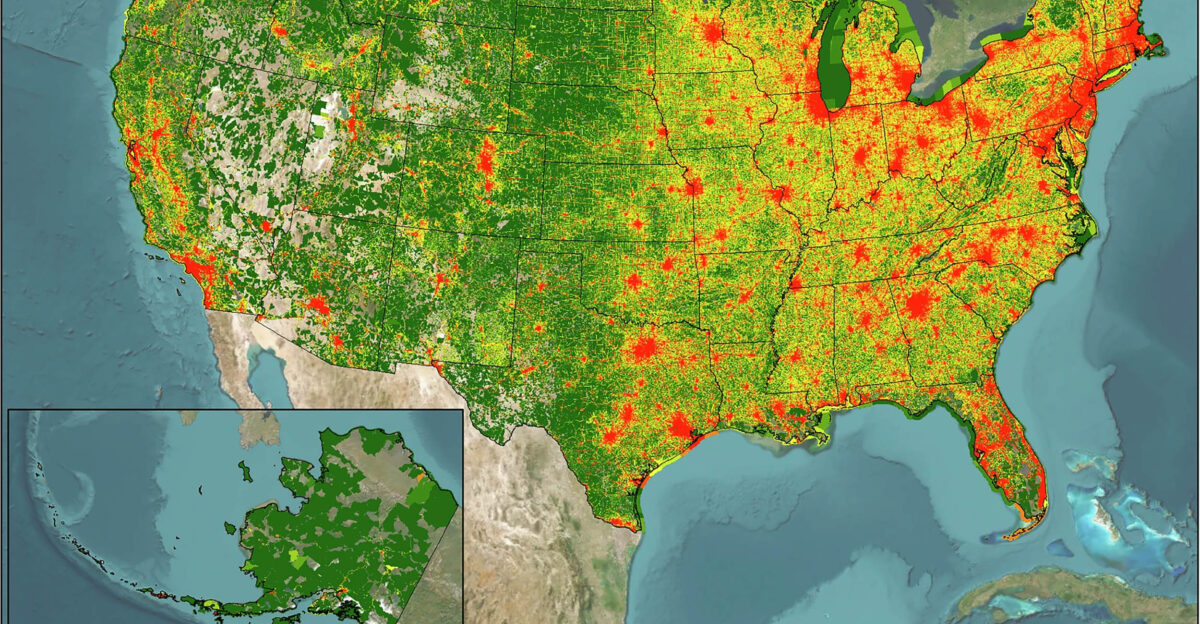
The Vulcan v4.0 dataset represents the most comprehensive nationwide emissions inventory to date, covering 49 states in high-resolution gridded format with Hawaii available in non-gridded form. This nationwide scope surpasses previous U.S. tracking efforts, which relied on patchwork combinations of EPA reporting, state inventories, and academic studies. Compared to Europe’s routine facility-level disclosures or China’s city-block integrations in some areas, the Vulcan project establishes a new standard for U.S. emissions transparency. The dataset focuses on emission sources rather than air dispersion or health effects like those from particulates or nitrogen dioxide. Scientists note it illuminates burning locations without equating proximity to personal exposure.
Future Stakes and Paths Forward
Funded by the Department of Energy, NASA, and other federal agencies, Vulcan’s longevity hinges on grants amid shifting priorities. Cities such as Los Angeles, Indianapolis, and others weave it into zoning, decarbonization, and wildfire-risk planning. Environmental groups train communities for activism, attaching CO₂ numbers to local gridlock or industrial burdens. Investors eye it for climate-risk pricing in supply chains and assets. As Congress scrutinizes the EPA proposal, the choice looms: bolster mandatory reporting or rely on researcher-driven maps. Vulcan v4.0 marks a threshold—transparency could solidify as expectation or fade into improvised tools, determining accountability in a bottom-up climate era.
Sources:
Scientific Data – “Vulcan version 4.0 high-resolution annual carbon dioxide emissions in the United States” – December 16, 2025
U.S. Environmental Protection Agency – “Greenhouse Gas Reporting Program Overview” – 2024
NASA Earth Observatory – “Annual Carbon Emissions in the United States” – October 2025
SciTechDaily – “Scientist Maps CO2 Emissions for Entire US” – October 2020
Earth.com – “Pollution hotspots exposed in stunning new carbon maps” – December 2025
Zenodo – “Vulcan version 4.0 high-resolution annual fossil fuel and biogenic CO2 emissions in the United States” – December 2025