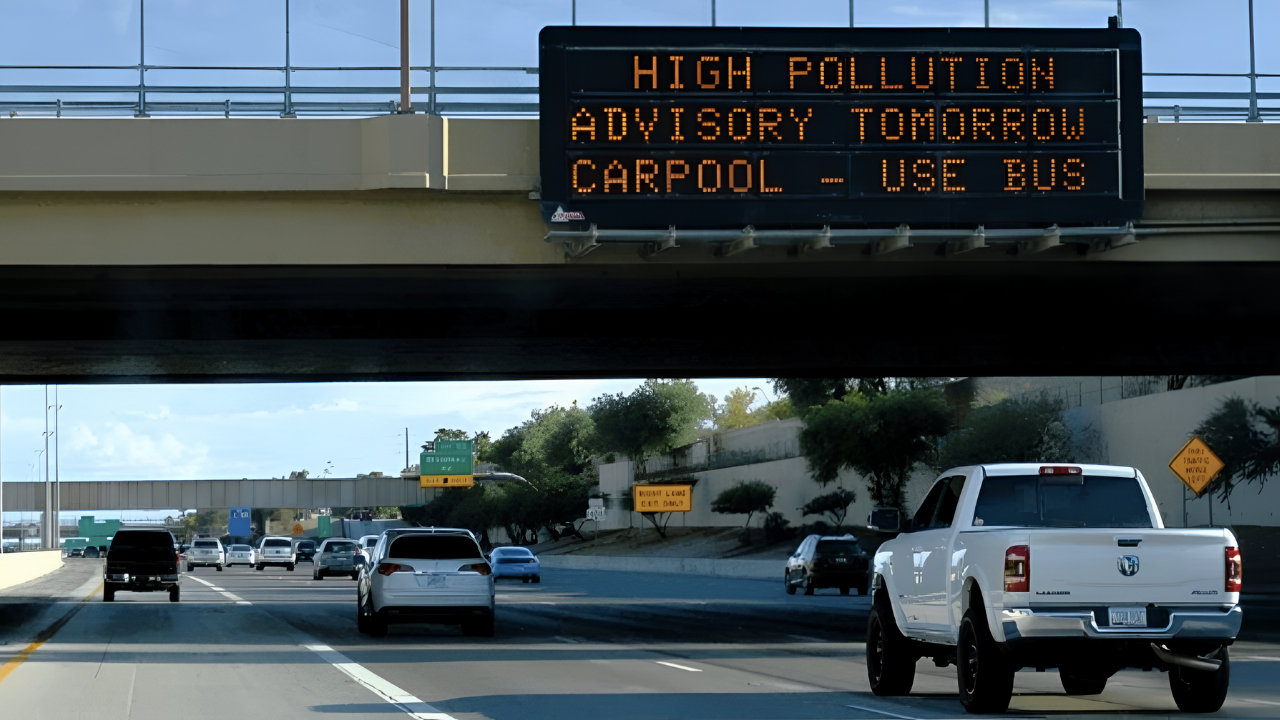
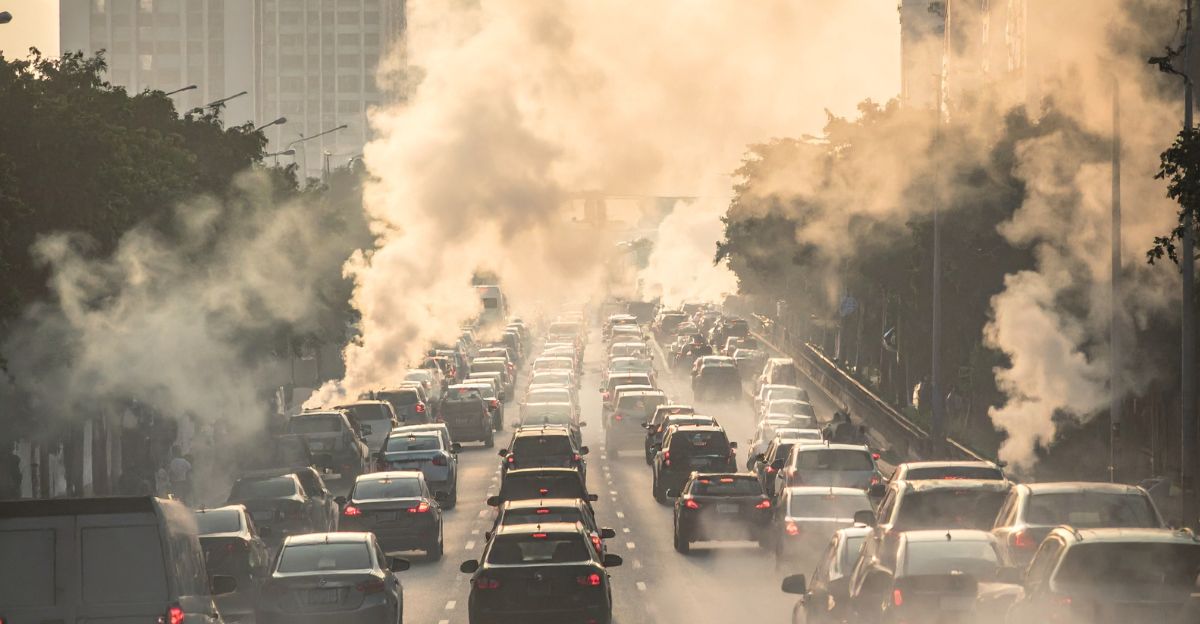
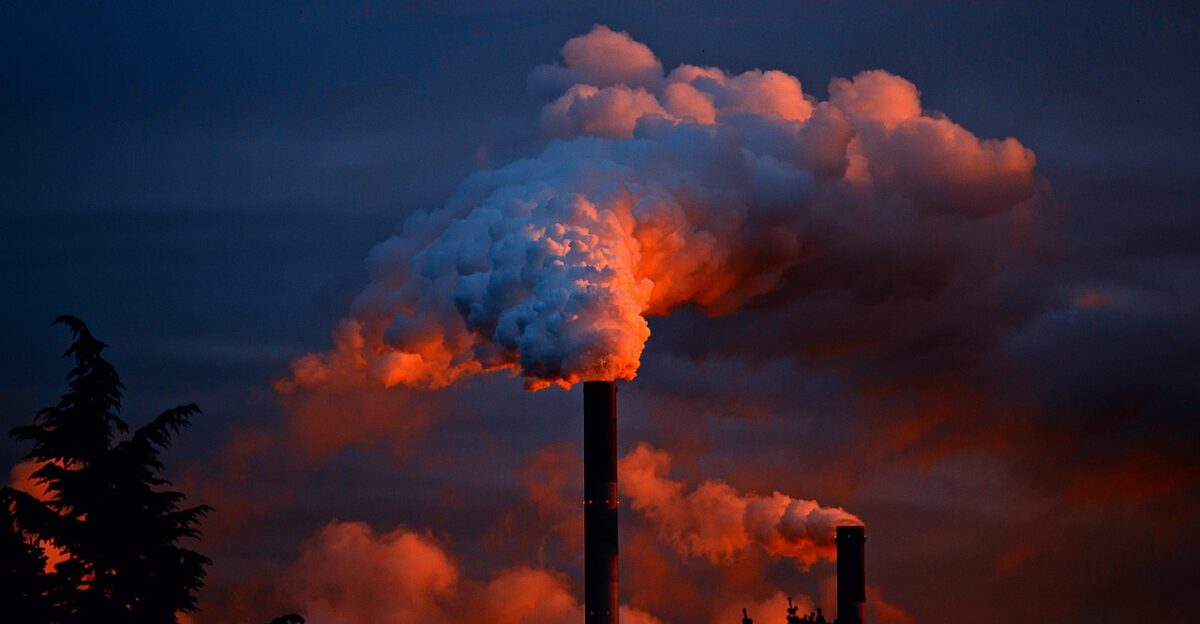
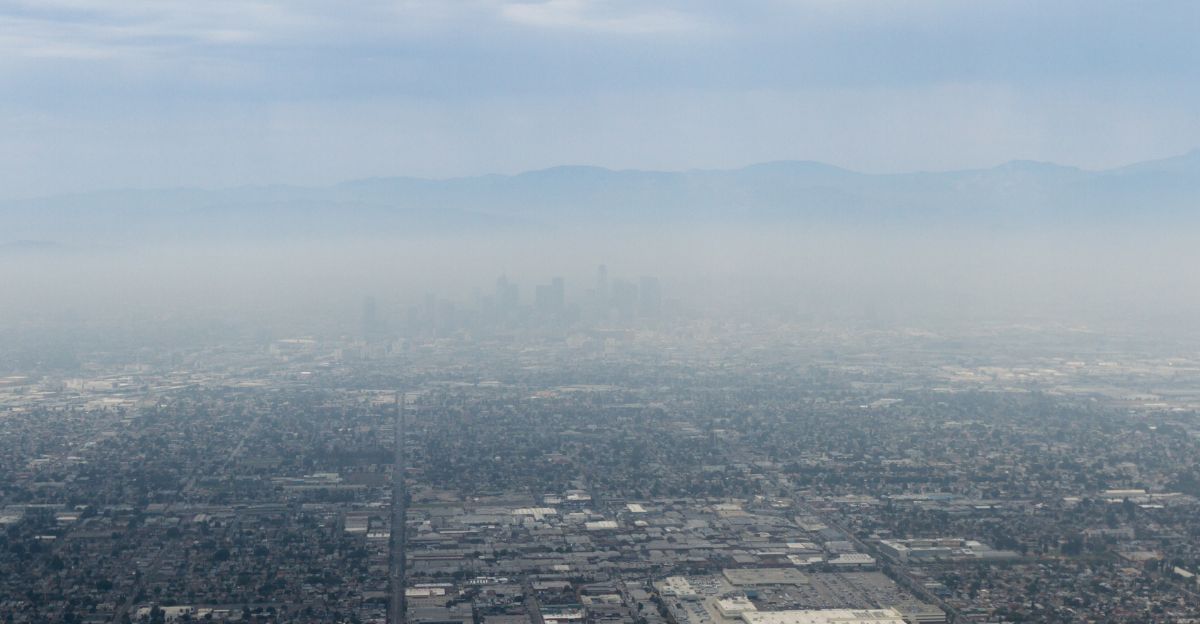
For decades, Americans relied on national pollution averages—broad figures that obscured the real dangers. While the EPA provided aggregate emissions data by state and sector, these figures failed to pinpoint the harmful sources right in your own backyard, the factory down the street, or the highway choking your neighborhood.
These averages concealed the actual pollution hotspots, leaving many unaware of the toxic risks surrounding them.
But now, the silence is finally breaking, and the truth about local pollution levels is being revealed like never before.
The Silence Before the Storm
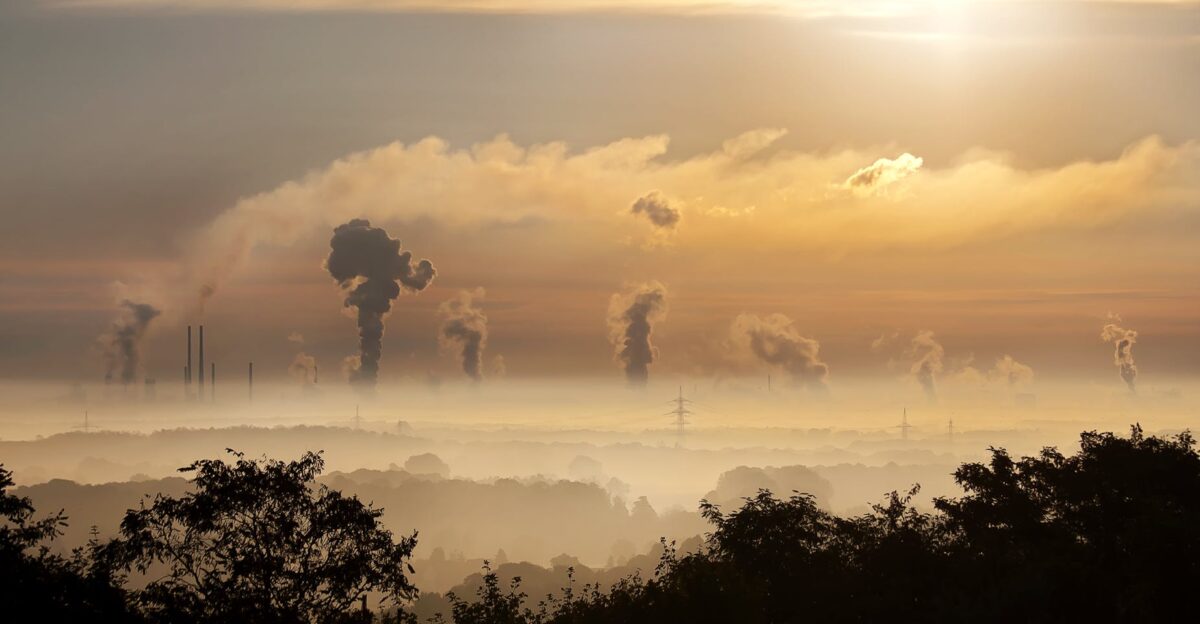
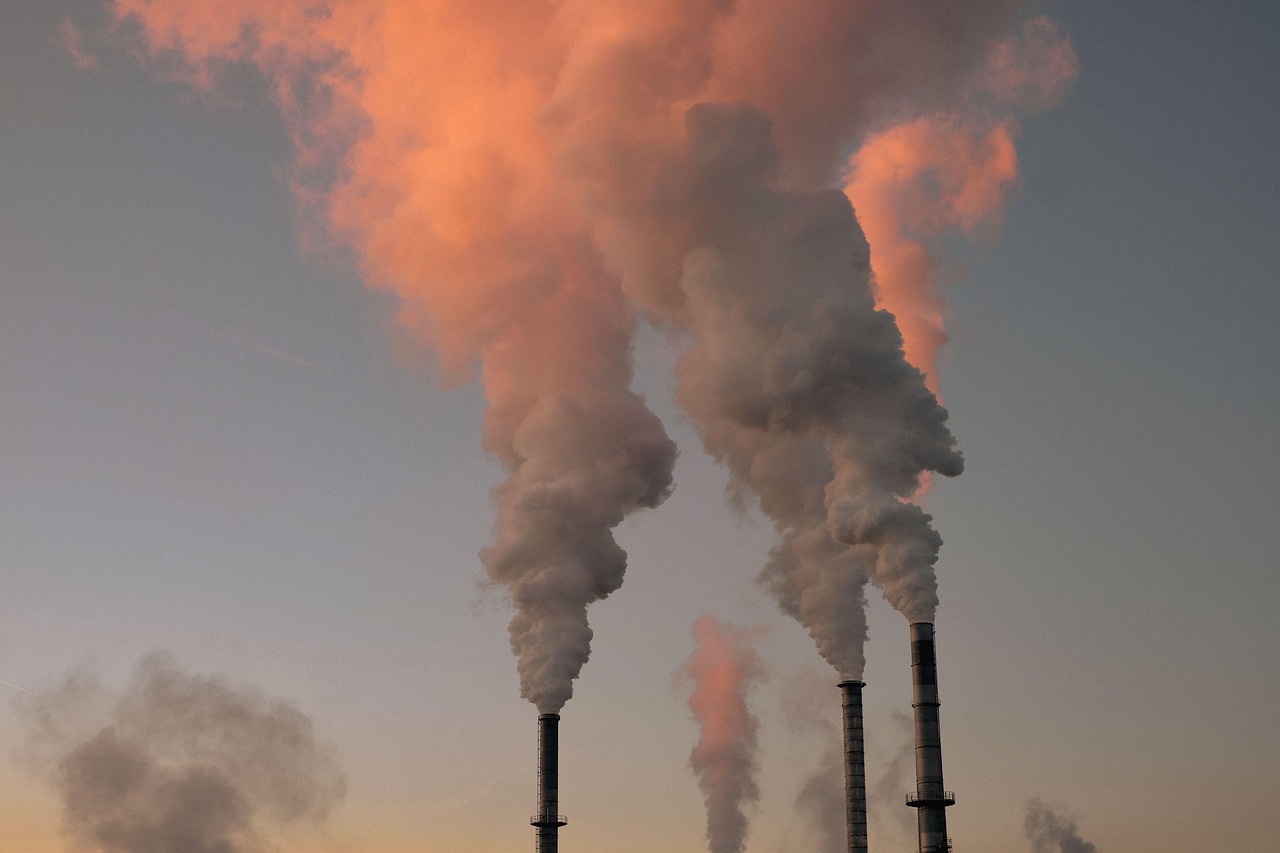
Regulators knew emissions came from somewhere. Power plants reported their output. Utilities disclosed fuel use.
However, the granular picture—where exactly CO₂ entered the air, block by block—remained fragmented: traffic models, power-generation logs, and building surveys.
No one had stitched them together at street scale before, and lawmakers were about to make that worse.
Two Decades of Mapping
A Northern Arizona University atmospheric scientist named Kevin Gurney had been quietly assembling this puzzle since 2002.
His project, called Vulcan, began as an academic exercise: to prove that it was possible to reconstruct where America burned carbon, down to the block level.
Version 1 was crude. Versions 2 and 3 have improved. By 2024, Vulcan was a proven system—ready to scale.
The EPA’s Rollback Plan
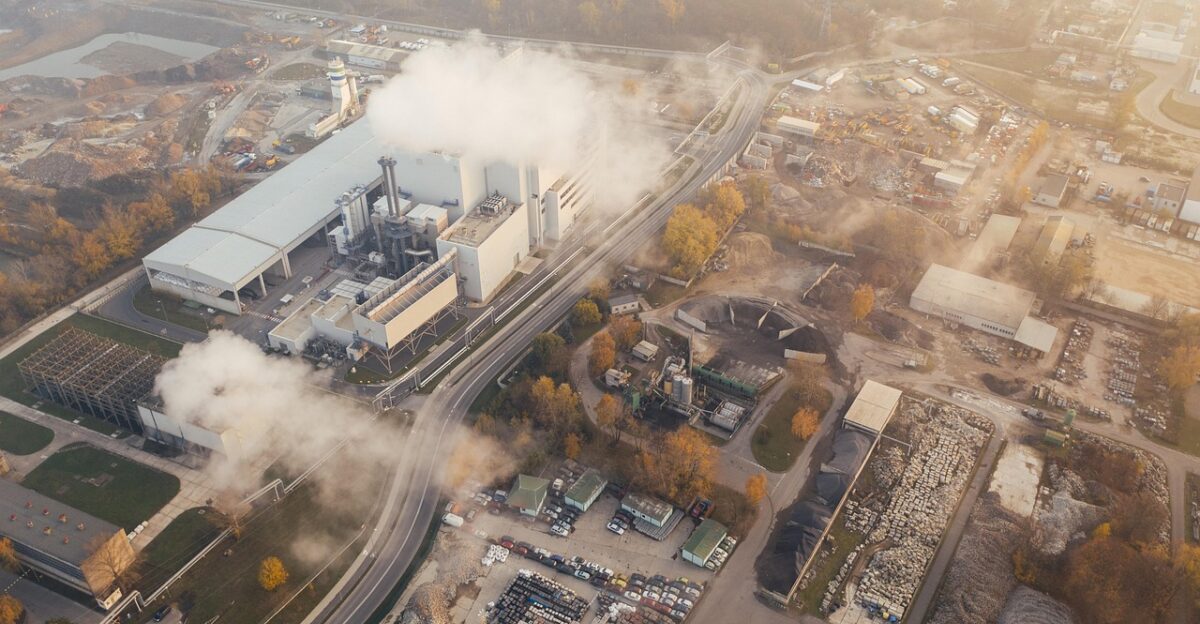
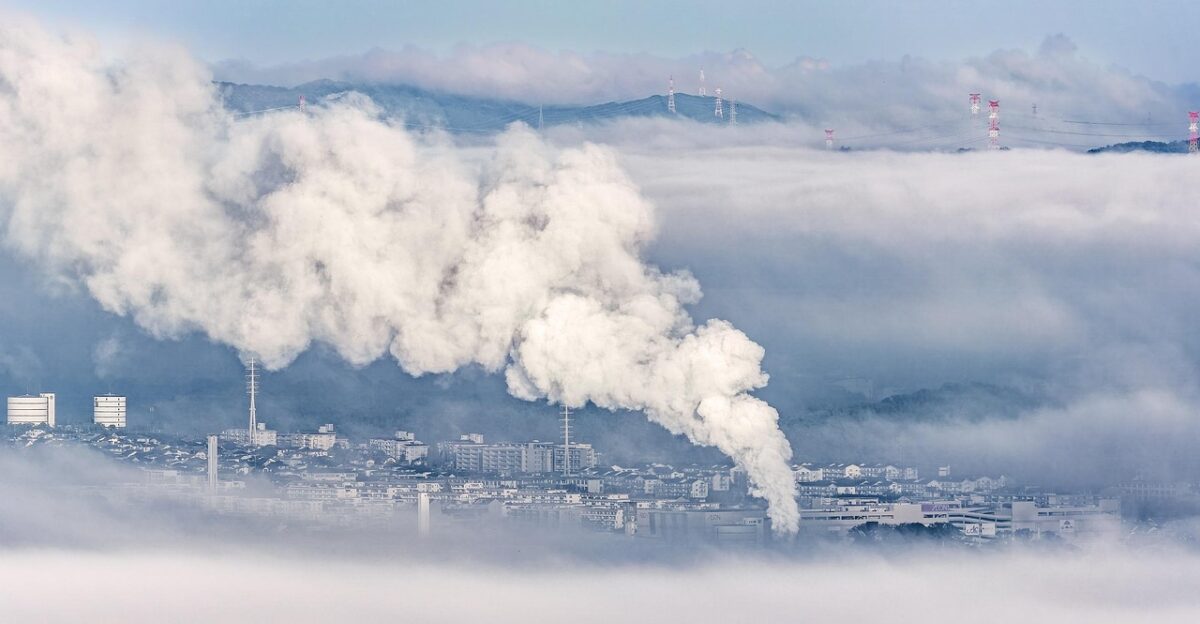
In September 2025, the EPA proposed something unthinkable: ending the Greenhouse Gas Reporting Program, a 20-year mandate that requires large facilities emitting 25,000 metric tons of CO₂ annually to disclose their emissions publicly.
Thousands of power plants, refineries, and cement makers would go dark. The transparency regime was collapsing—right before new tools could expose what it had hidden.
The Map Arrives

On December 16, 2025, Gurney and Northern Arizona University released Vulcan v4.0. It was the first 13-year, block-by-block CO₂ emissions map of the entire continental U.S. and Alaska.
One-kilometer-resolution grid cells. Pinpointed power plants, traffic, buildings, and cement factories. Two hundred thousand map files on Zenodo, a public repository.
And timing matters: it dropped as the EPA prepared to extinguish the data-sharing mandate it had enforced for two decades.
What Families Actually See
The dataset spans 2010 to 2022. For any address in the lower 48 states and Alaska, residents can now download data showing annual CO₂ emitted from their Census block.
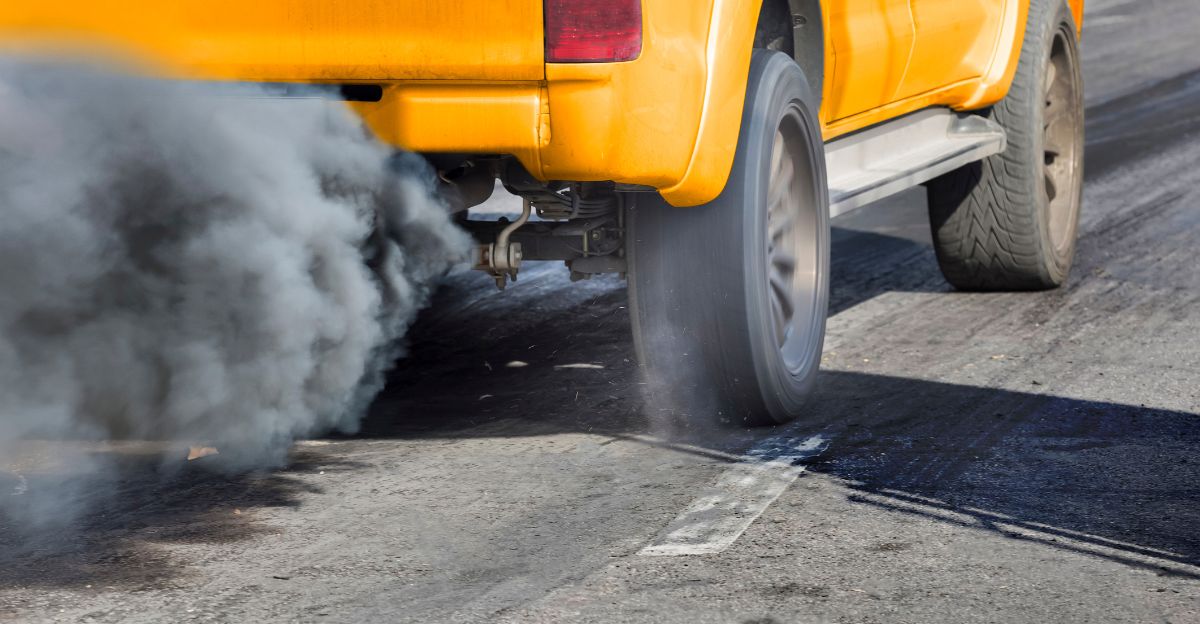
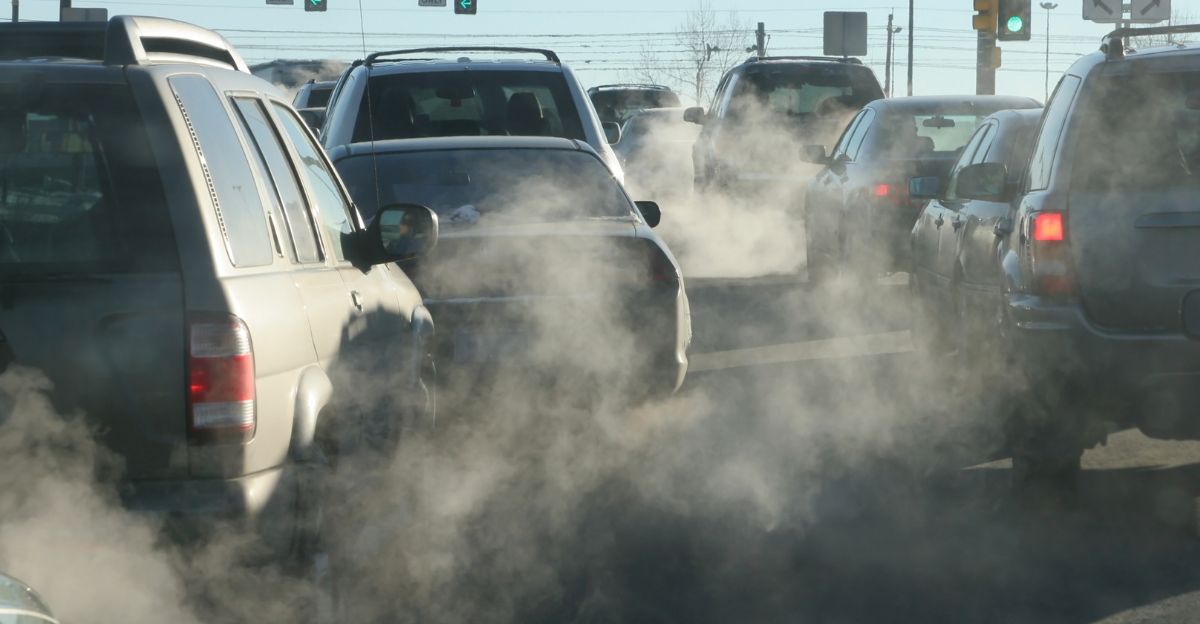
A neighborhood near a highway sees higher road-transport emissions.
A block downwind of a coal plant shows factory output. Schools near industrial zones get numbers. For the first time, families can now view their block’s pollution score, which is now rendered visible.
The Scale of Silence
The dataset contains hundreds of terabytes of granular data. Over 8 million grid cells across the continental U.S.
Thousands of power plants and industrial facilities are assigned exact emissions coordinates. Hundreds of thousands of road segments are mapped individually.
Yet despite public access via Zenodo, processing this volume requires high-performance computing, limiting how many families will actually visualize their block’s pollution profile without specialized tools.
The EPA’s Competing Future
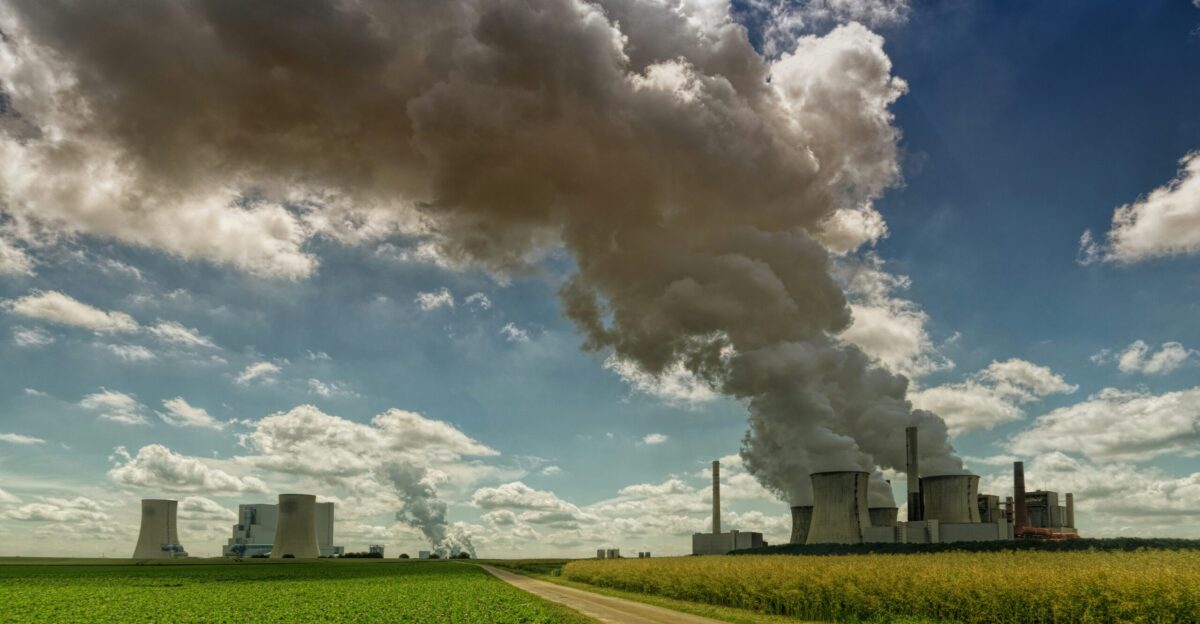
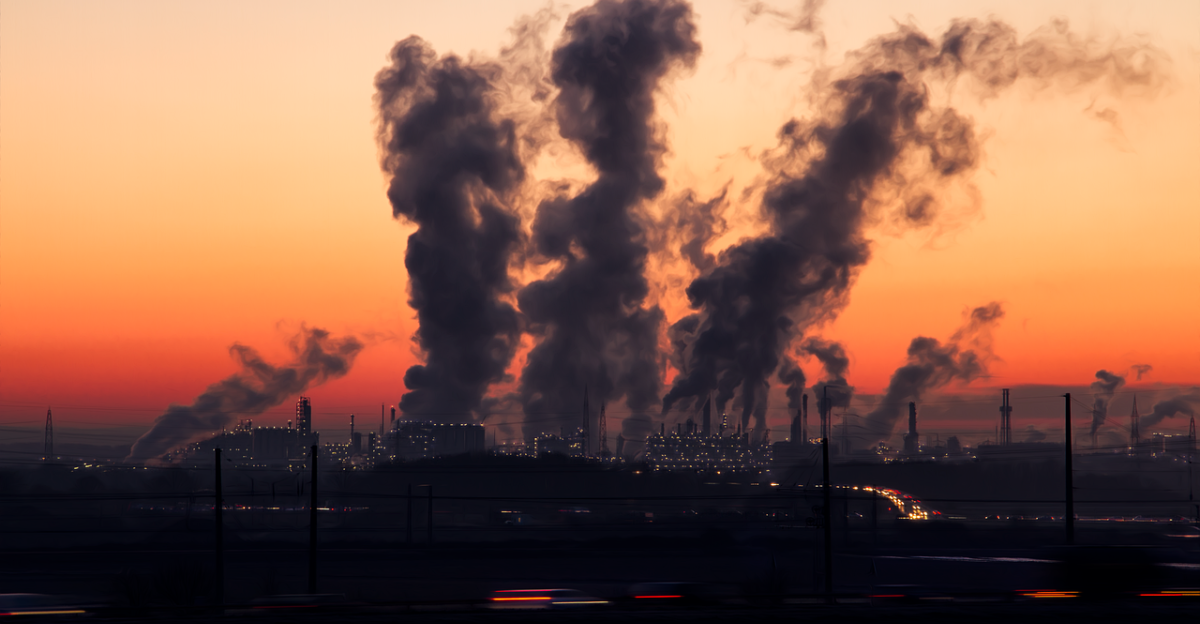
The EPA’s September 2025 proposal to dismantle the Greenhouse Gas Reporting Program would silence roughly 8,000 large facilities currently required to report emissions.
No annual disclosures. No public benchmark. No accountability track record.
Vulcan v4.0 exists partly because of that regulatory vacuum—independent science filling the gap that the government is abandoning. The irony is sharp: transparency arrives as the transparency mandate dies.
The Global Context
U.S. emissions tracking lags Europe’s transparency systems. The European Union publishes facility-level CO₂ data on a routine basis.
China integrates emissions into regional planning at city-block scales in some provinces. America’s patchwork—GHGRP for large facilities, state-level inventories, academic projects—never cohered into a unified national map until Vulcan v4.0.
The gap explains why this academic dataset is international news and why its timing feels like a last stand.
The Hawaii Footnote

Vulcan v4.0 covers the lower 48 states and Alaska—but not Hawaii. The dataset omits an entire state, likely due to data-sourcing gaps for the islands.
This gap is rarely mentioned in celebratory coverage but matters: 1.4 million Americans live in Hawaii, and their block-level emissions remain invisible.
The “unprecedented national map” actually refers to the 49 states, a reminder that even cutting-edge transparency has its blind spots.
Researchers vs. Regulators
Kevin Gurney has spent 23 years building emissions maps with shrinking federal funding and shifting political winds.
Releasing v4.0 as the EPA retreats from emissions mandates reflects the team’s determination.
‘The U.S. taxpayers have a right to this data,’ Gurney said, adding that ‘despite the science funding cuts and threats to federal science data reporting,’ his team will continue producing critical climate data.”
The Funding Question
Academic datasets rely on sustained grants. Vulcan has been funded by the Department of Energy, the National Science Foundation, and the National Aeronautics and Space Administration.
But as climate policy shifts and priorities change, funding uncertainty clouds Vulcan’s future.
Gurney’s team would need continued support to update v4.0 beyond 2022, to add Hawaii, or to incorporate real-time emissions tracking. Version 5 is not guaranteed.
Community Action Plan

Some environmental groups are already training community members to use Vulcan data. Universities are integrating block-level emissions into climate action plans.
Cities like Boulder and San Francisco are incorporating Vulcan into their zoning decisions.
The dataset is enabling a new tier of local activism: residents with proof of their neighborhood’s pollution burden can demand changes. For the first time, gridlock near a school has a CO₂ number attached.
Technical Skepticism
Climate scientists caution that high-resolution emissions maps don’t directly translate to health impacts. CO₂ is a global climate pollutant, not a local respiratory hazard like PM2.5 or nitrogen dioxide.
Vulcan shows where carbon is burned, not how pollution actually moves through the air or affects the lungs. Proximity to a high-emissions block doesn’t automatically mean high exposure.
The data is illuminating but not a substitute for detailed air-quality monitoring at the neighborhood scale.
The Real Question
If the EPA dismantles emissions reporting, will Vulcan fill the void or become an increasingly isolated academic artifact?
Gurney’s maps exist now, publicly available. However, without routine facility disclosures, updating them becomes increasingly complex every year.
The real test begins in 2026: Does Congress block the EPA’s rollback, or does America accept a future where emissions data comes only from researchers working without regulatory obligation or funding certainty?
Congress’s Role

The EPA proposal faces Congressional scrutiny. Some lawmakers argue that dismantling the GHGRP would undermine climate policy, corporate accountability, and investor decision-making.
Others defend rollback as regulatory relief. The outcome will determine whether Vulcan v4.0 serves as a stepping stone for stricter transparency rules or a culmination of an era of mandatory emissions disclosure.
Stakes are high because if facility reporting ends, future Vulcan versions lose their richest data source.
The Investor Angle
Large asset managers, pension funds, and insurance companies rely on corporate emissions disclosures to price climate risk.
Vulcan’s block-level mapping appeals to institutional investors seeking to assess localized climate exposure—such as supply-chain risk near a flood zone or asset value in high-emissions areas.
If GHGRP dies, investors will turn to alternative sources. Vulcan could become critical infrastructure for climate-conscious capital, raising its strategic value even as government funding shrinks.
Climate Action Plans
Cities and states are already weaving Vulcan data into climate action plans. New York is using it to identify neighborhoods for decarbonization investment.
California is overlaying Vulcan with wildfire risk to identify where electrification matters most.
These uses suggest that granular emissions maps are becoming regulatory infrastructure at state and local scales—even as federal policy retreats. The bottom-up climate governance era, in some sense, has begun.
The Generational Divide
Gen Z carries the emotional weight of climate change more heavily than any other generation. Nearly 60% report extreme worry, and 45% say climate concerns affect their daily functioning, according to global surveys.
However, research shows that younger Americans are increasingly inclined to believe that individual action is futile—over half of 18-34 year-olds say that only corporations and the government can reduce climate change.
Vulcan v4.0 arrives at this paradox: unprecedented data transparency meeting unprecedented feelings of powerlessness.
The Threshold Moment
Vulcan v4.0 is not the end of the emissions-mapping story. It is a threshold. On one side: a world where government mandates corporate emissions disclosure, scientists verify data, and the public holds polluters accountable through transparency.
On the other hand, a world where federal oversight fades, and academic researchers, investors, and activists scramble to fill the gap with improvised tools.
America is choosing sides. Vulcan v4.0 arrived as that choice became visible. What happens next depends on whether transparency is a temporary trend or a permanent expectation.
Sources:
Scientific Data – “Vulcan version 4.0 high-resolution annual carbon dioxide emissions in the United States” – December 16, 2025
U.S. Environmental Protection Agency – “Greenhouse Gas Reporting Program Overview” – 2024
NASA Earth Observatory – “Annual Carbon Emissions in the United States” – October 2025
SciTechDaily – “Scientist Maps CO2 Emissions for Entire US” – October 2020
Earth.com – “Pollution hotspots exposed in stunning new carbon maps” – December 2025
Zenodo – “Vulcan version 4.0 high-resolution annual fossil fuel and biogenic CO2 emissions in the United States” – December 2025
Phys.org – “13 years of detailed US CO₂ emissions data released” – December 16, 2025