` 8 Feet Of Snow Slams 5 States As 105M Americans Face 'Impossible' Christmas Travel - Ruckus Factory

8 Feet Of Snow Slams 5 States As 105M Americans Face ‘Impossible’ Christmas Travel

Red Raccoon Games – Facebook

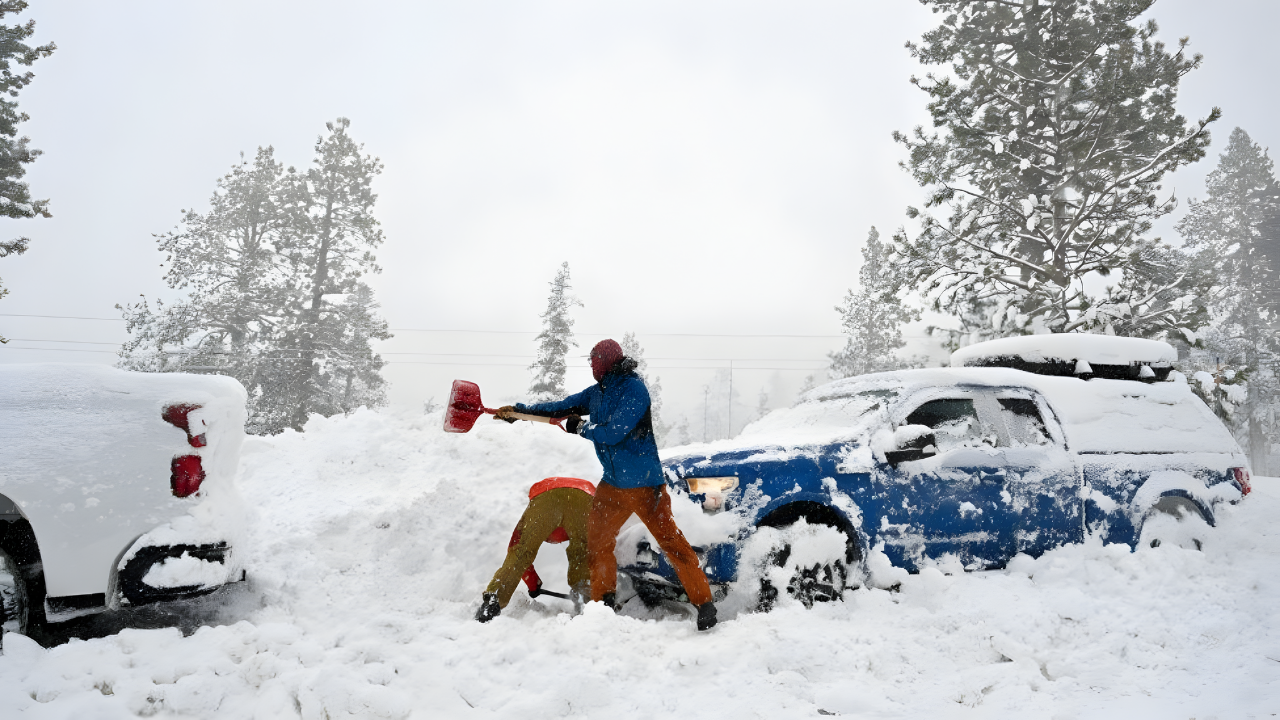
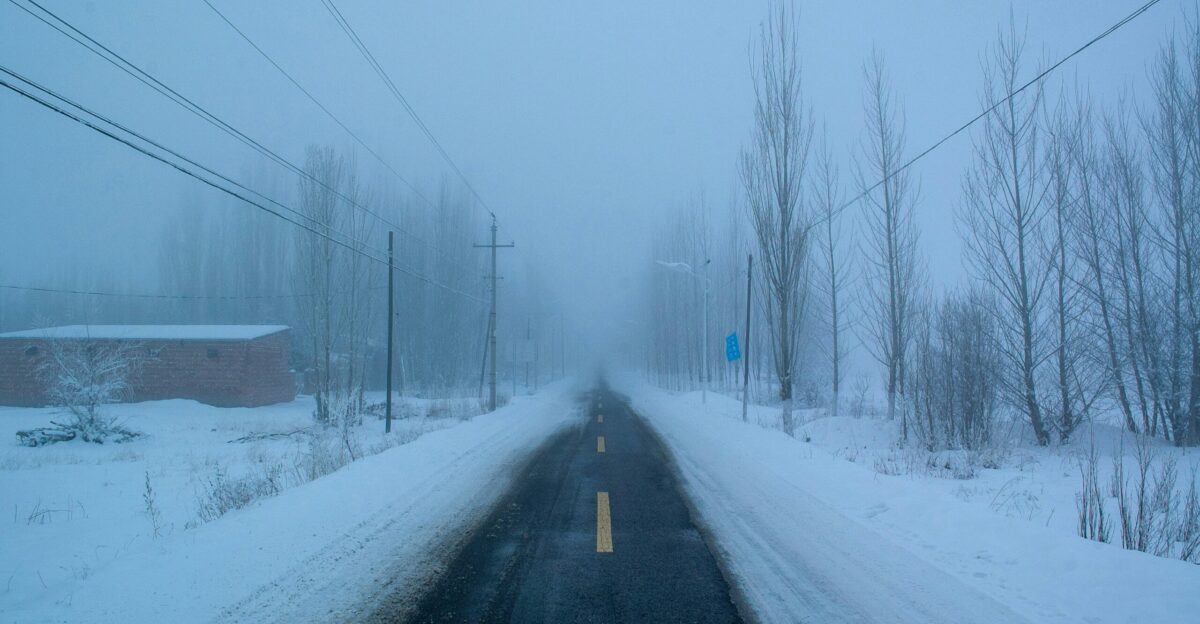
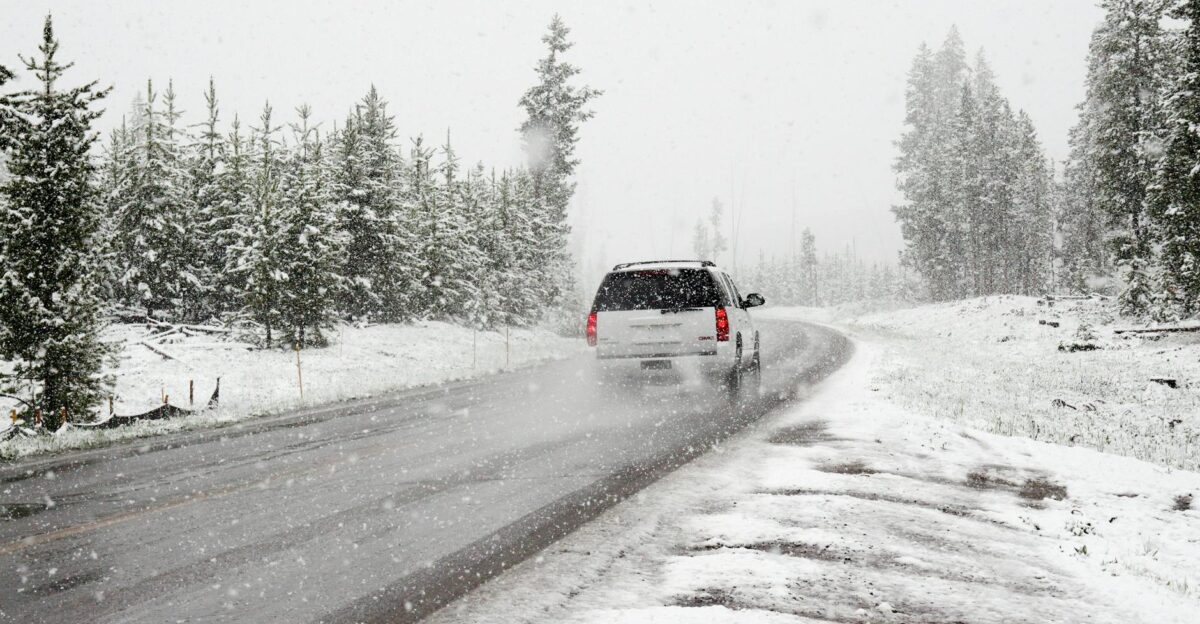
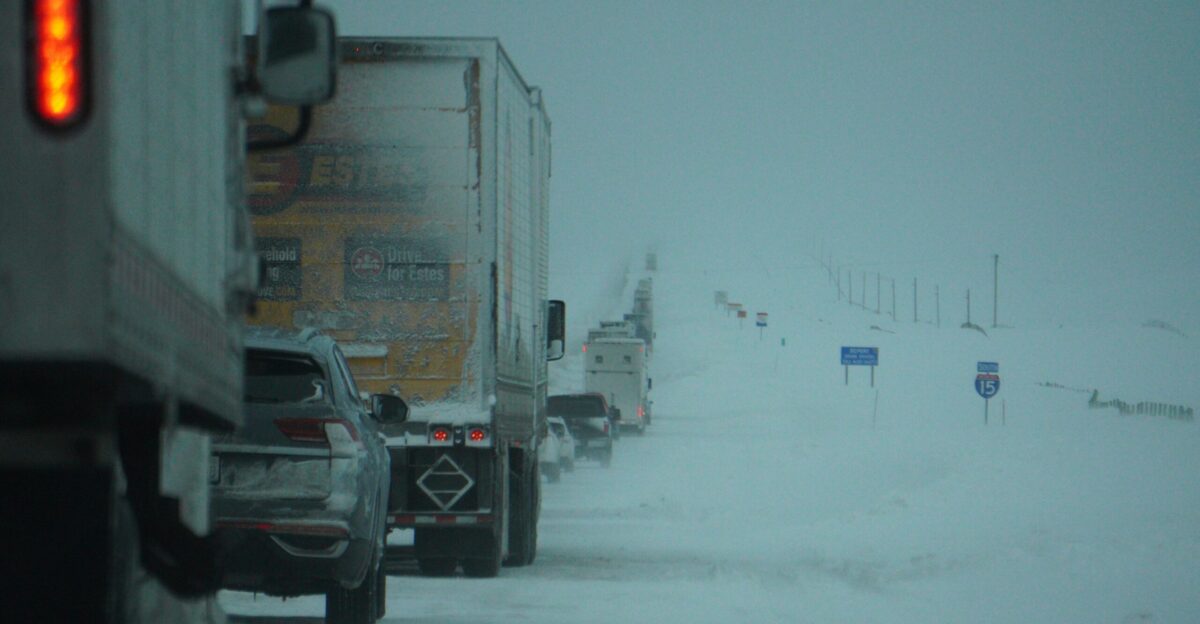
Headlights crawl along snow-darkened highways as wind-driven flakes erase lane markings in real time. Winter Storm Warnings flash across five Western states. The National Weather Service uses unusually blunt language: “Travel could be very difficult to impossible.”

This is unfolding during the busiest travel window of the year. More than 122 million Americans are already on the move—many heading straight toward a record-setting winter storm system colliding with Christmas week.

The Setup

a snowy field with a clock tower in the background
Photo by Doni Rath on Unsplash

AAA projects over 122 million Americans will travel at least 50 miles during the holiday period, the highest year-end forecast ever recorded. Travel demand stretches from December 20 through January 1, expanding exposure to weather disruptions.

While airlines and trains are near capacity, driving dominates plans. Behind the optimism of post-pandemic mobility, meteorologists are tracking a major Pacific system that threatens to overwhelm infrastructure just as travel peaks.

Driving Takes Over

empty road during daytime
Photo by Louis Zhang on Unsplash

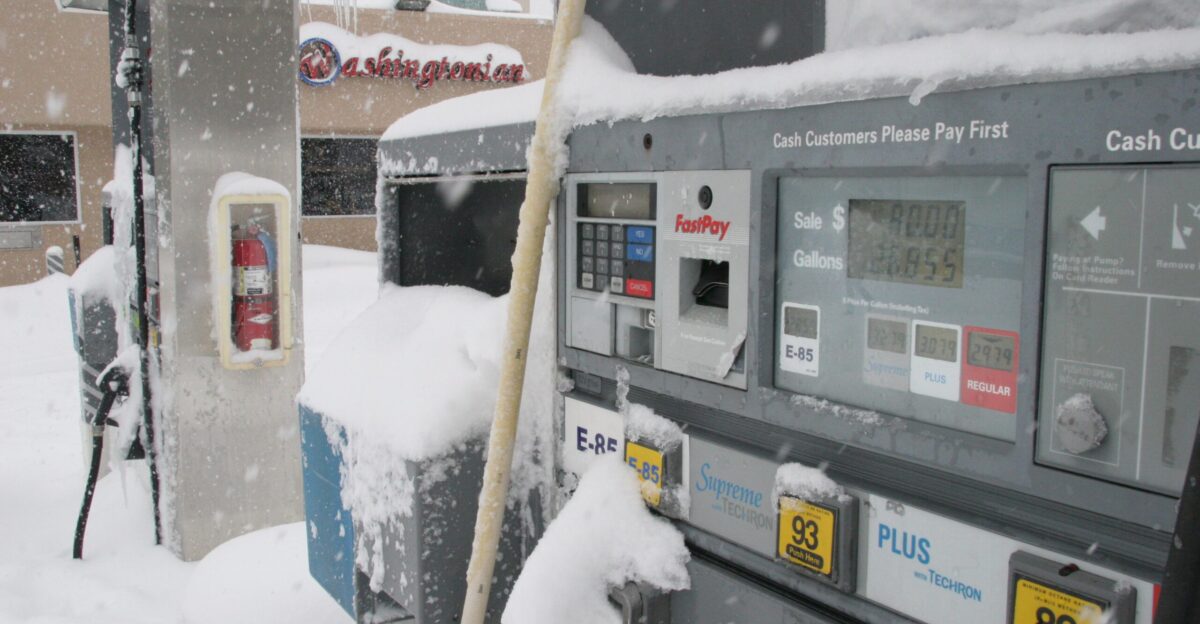
An estimated 109.5 million travelers—89% of all holiday travelers—will drive, according to AAA. Lower fuel costs help explain why: the national gas price average has dipped below $3.00 for the first time in four years.

For many families, road trips feel both economical and flexible. But those same choices place millions directly onto mountain highways as an atmospheric river begins pushing inland during Christmas week.

The Atmospheric River Explained

A precipitation-filled atmospheric river struck southern California in mid-February 2025 kicking off the fifth coast-to-coast storm to strike the United States since the start of the new year Heavy rain drenched much of the region on February 12-14 including areas recently ravaged by wildfires Local media reported that on February 13 one highway intersection near Pacific Palisades was buried under at least 3 feet 1 meter of sludge It was also reported that a road near the Eaton Fire burn scar near Altadena California was covered in several feet of mud vegetation and trees despite a concrete block wall designed to prevent debris flows Several media outlets showed several cars mired in mud flows In the mountains the precipitation is in the form of heavy snow Mammoth Mountain In the Sierra Nevada mountains posted on Instagram on February 14 that it received about 6 feet 72 inches 183 cm in the previous 36 hours They also noted that two of its ski patrol staff were caught in an avalanche on that same morning The resort s website notes that risk of avalanche is extreme and the slopes will be closed on February 15 This strong system is expected to continue to disrupt conditions across the United States as it plows forward crossing the Rocky Mountains the Plains the Great Lakes States and eventually the Northeast over the upcoming weekend On February 13 the Moderate Resolution Imaging Spectroradiometer MODIS on NASA s Aqua satellite acquired this true-color image of the long atmospheric river arching northeastward over the Pacific Ocean to strike the southwestern coast of the United States The city of Los Angeles California is buried under the thickest area of cloud
Photo by MODIS Land Rapid Response Team NASA GSFC on Wikimedia

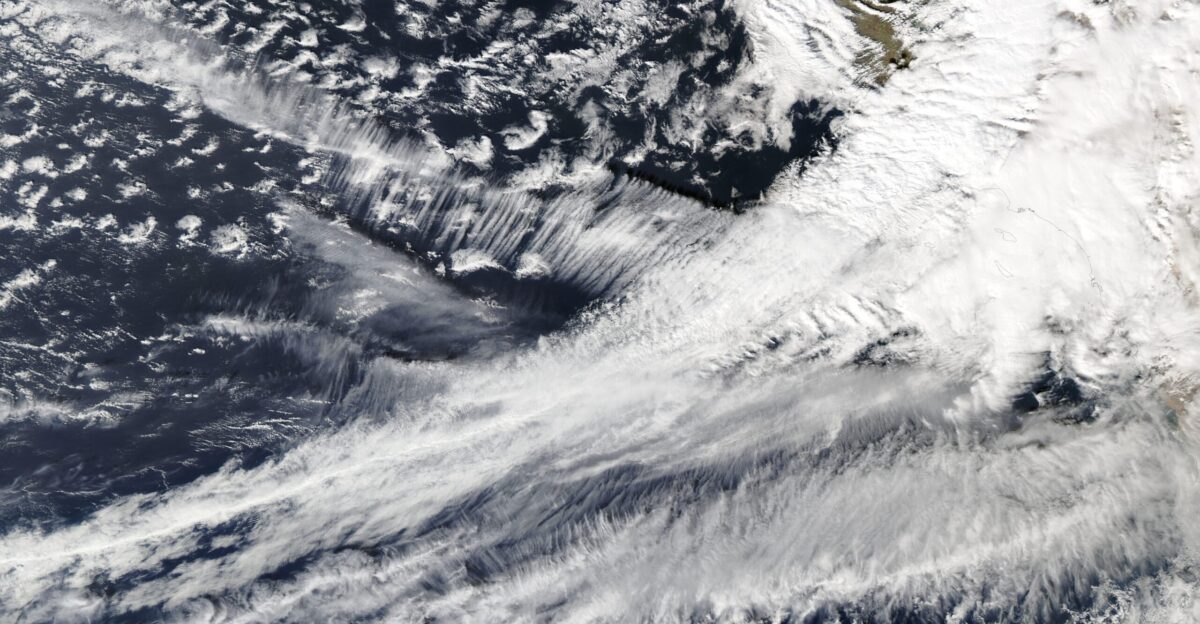
An atmospheric river is a narrow, elongated corridor of water vapor stretching thousands of miles across the ocean. Scientists often describe it as a conveyor belt, funneling tropical moisture toward land.

According to the U.S. Geological Survey, strong atmospheric rivers can carry 7 to 15 times the daily water flow of the Mississippi River. As global temperatures rise, these systems are becoming stronger, wetter, and more frequent.

Building Pressure

Flooded road Marine Drive south of Stanwood Washington
Photo by PK-WIKI on Wikimedia

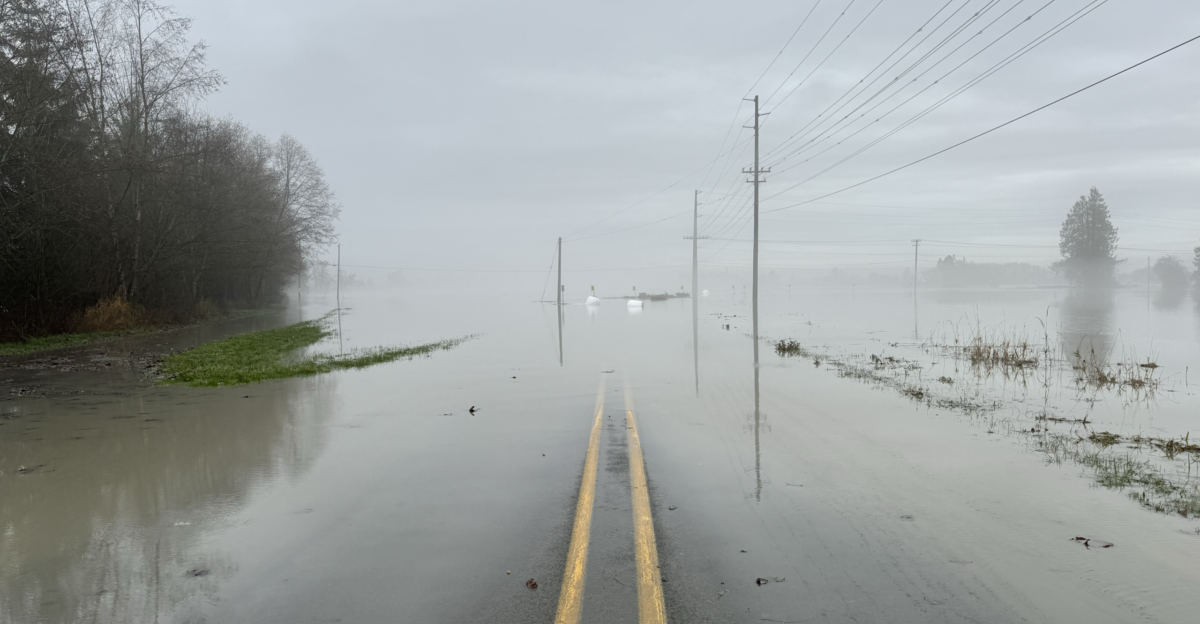
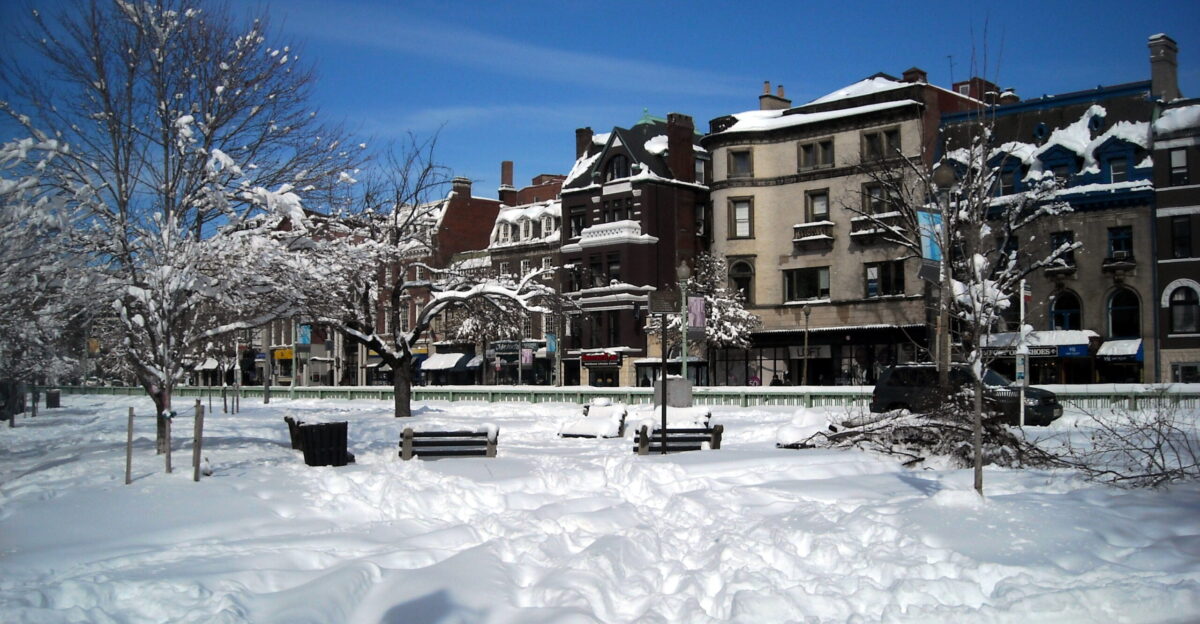
December 2025 has already saturated the Pacific Northwest. Early storms dumped more than 5 trillion gallons of rain across Washington State, triggering floods and landslides. Soils remain waterlogged as another powerful system targets California and the Sierra Nevada.

Timing is critical: this storm arrives precisely when holiday travel surges. The overlap between saturated ground, heavy precipitation, and peak mobility creates an unusually high-risk scenario.

Eight Feet Forecast

<br>
<dl><dd><i>Snow coats Yosemite Valley in Yosemite National Park, California, during a winter storm, 1850-1930</i></dd>
<dd>Photograph of snow coating Yosemite Valley in Yosemite National Park, California, during a winter storm, 1850-1930. A meadow beyond a wooden post and rail fence sits at the base of steep mountain slope. A building is visible at the far side of the meadow.</dd></dl>
<dl><dd><b>Call number</b>: CHS-1202</dd>
<dd><b>Photographer</b>: Fiske, George</dd>
<dd><b>Filename</b>: CHS-1202</dd>
<dd><b>Coverage date</b>: 1850/1930</dd>
<dd><b>Part of collection</b>: California Historical Society Collection, 1860-1960</dd>
<dd><b>Format</b>: glass plate negatives</dd>
<dd><b>Type</b>: images</dd>
<dd><b>Part of subcollection</b>: Title Insurance and Trust, and C.C. Pierce Photography Collection, 1860-1960</dd>
<dd><b>Repository name</b>: USC Libraries Special Collections</dd>
<dd><b>Accession number</b>: 1202</dd>
<dd><b>Microfiche number</b>: 1-60-50; 1-60-51</dd>
<dd><b>Archival file</b>: chs_Volume90/CHS-1202.tiff</dd>
<dd><b>Repository address</b>: Doheny Memorial Library, Los Angeles, CA 90089-0189</dd>
<dd><b>Geographic subject (country)</b>: USA</dd>
<dd><b>Format (aacr2)</b>: 2 photographs : glass photonegative, photoprint, b&w ; 17 x 22 cm.</dd>
<dd><b>Rights</b>: Digitally reproduced by the USC Digital Library; From the California Historical Society Collection at the University of Southern California</dd>
<dd><b>Subject (adlf)</b>: parks</dd>
<dd><b>Project</b>: USC</dd>
<dd><b>Repository email</b>: specol@usc.edu</dd>
<dd><b>Contributing entity</b>: California Historical Society</dd>
<dd><b>Date created</b>: 1850/1930</dd>
<dd><b>Publisher (of the digital version)</b>: University of Southern California. Libraries</dd>
<dd><b>Format (aat)</b>: photographic prints; photographs</dd>
<dd><b>Geographic subject (state)</b>: California</dd>
<dd><b>Legacy record ID</b>: chs-m14929; USC-1-1-1-14275</dd>
<dd><b>Access conditions</b>: Send requests to address or e-mail given. Phone (213) 821-2366; fax (213) 740-2343.</dd>
<dd><b>Subject (file heading)</b>: Natural features -- Parks -- Yosemite -- General views</dd>
<dd><b>Subject (lcsh)</b>: Yosemite national park (Calif.); Trees; Mountains</dd></dl>
Photo by George Fiske on Wikimedia

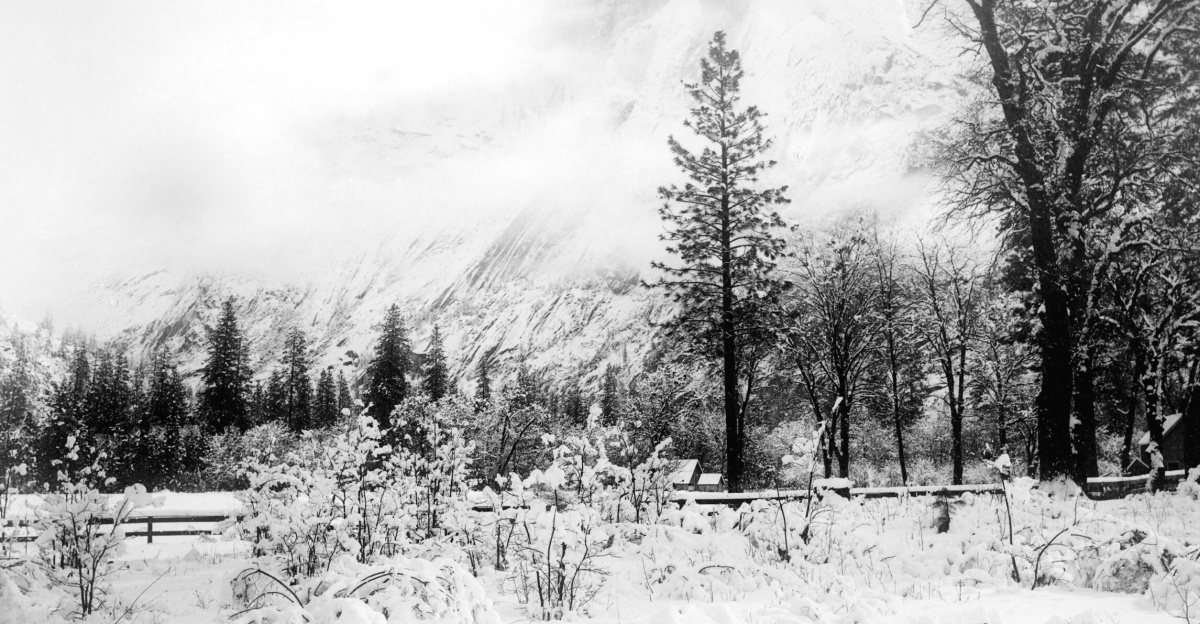
On December 21, the National Weather Service Hanford office issued a Winter Storm Warning for Yosemite National Park, forecasting 6 to 8 feet (up to 96 inches) of total snowfall through December 27.

Wind gusts are expected to reach 50 mph, with exposed ridgelines exceeding 100 mph. These numbers—confirmed across multiple sources—rank among the most extreme Sierra Nevada forecasts in recent memory.

Cascading Impacts Across California

Photo by NOAA on Wikimedia

Yosemite is not alone. The southern Sierra Nevada faces up to 7 additional feet of snow, while Mono County warnings describe conditions as “impossible” for travel.

Around Lake Tahoe, ski resorts anticipate 4 to 8 feet above 6,500 feet elevation. Interstate 80—California’s primary eastbound mountain corridor—sits directly in the storm’s path, intersecting with one of the year’s heaviest traffic periods.

A Traveler’s Dilemma

a car driving down a snow covered road
Photo by Mary Nicolais on Unsplash

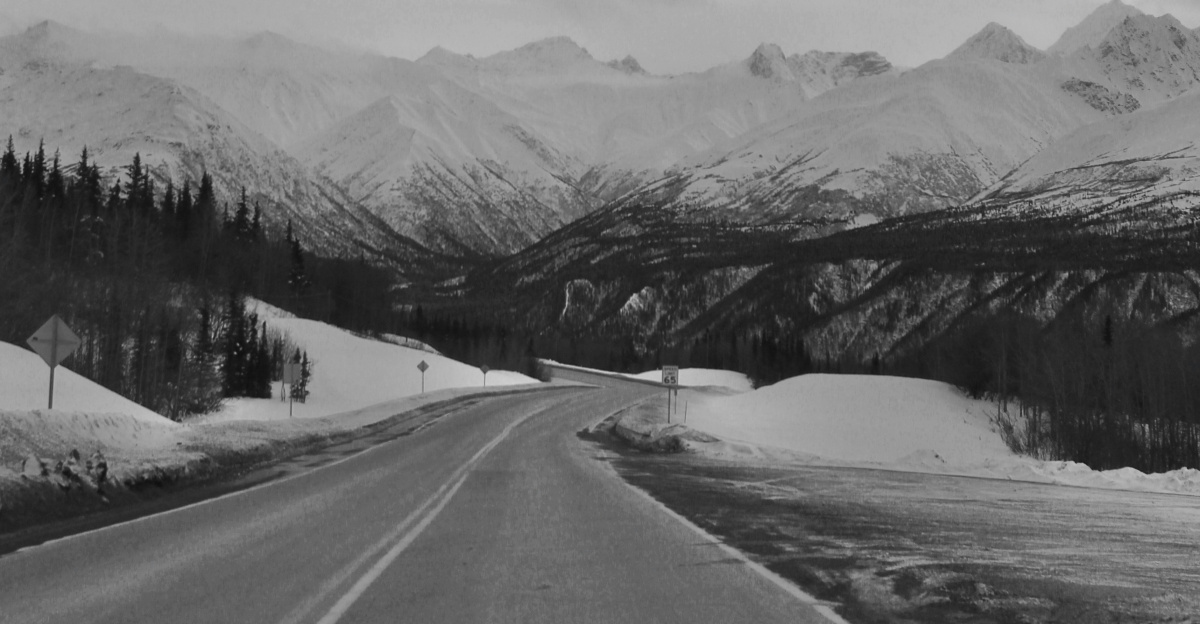
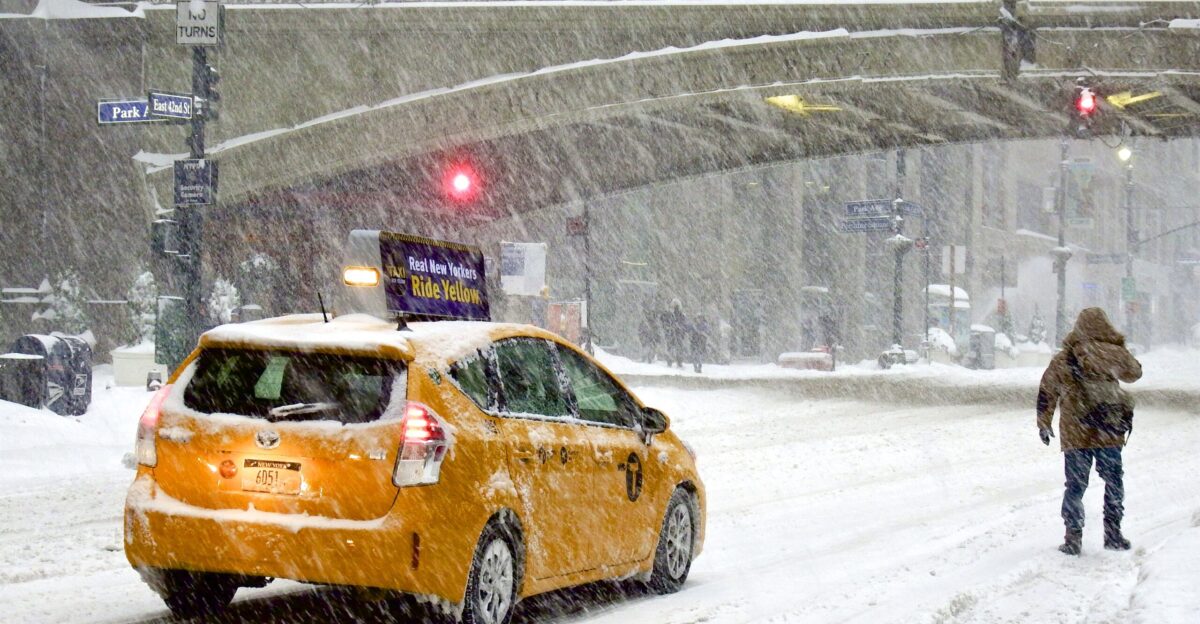
“Travel could be very difficult to impossible,” the NWS warns—language reserved for the most dangerous conditions. Whiteout visibility, falling trees, power outages, and snowfall rates exceeding plowing capacity are expected.

Caltrans urges travelers without winter-driving experience to avoid mountain routes entirely. Those who proceed are advised to carry food, water, flashlights, chains, and expect delays lasting hours—or longer.

Five States Under Alert

A gas station covered in snow- Photo by Sara Hassan
Photo by Sara Hassan of Al Jazeera English on Wikimedia

Winter storm warnings now span California, Washington, Wyoming, Montana, and Idaho, all connected by the same atmospheric river. Wyoming’s Teton and Wind River ranges face up to 40 inches of snow.

Montana’s Beartooth and Crazy Mountains carry avalanche warnings, while Washington’s Cascades—less accustomed to Sierra-scale snowfall—are also under winter alerts, underscoring the system’s geographic reach.

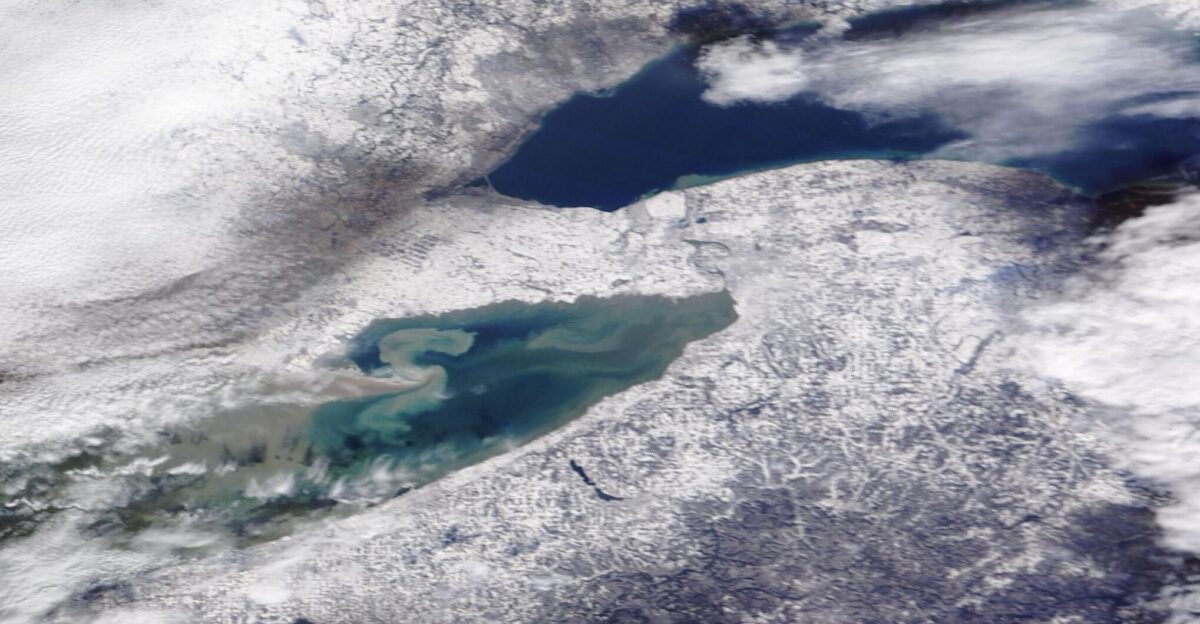
The Moisture Pipeline

A powerful atmospheric river swept through the Gulf of Alaska in September 2024, bringing abundant rain to coastal British Columbia, Canada, and southeastern Alaska. Because of its duration and the concentration of moisture moving across the ocean, experts suspect this atmospheric river was among the most intense to transit the northeast Pacific in a satellite-based record going back to 2000.
<p>The potent storm is visible in this image, acquired by the VIIRS (Visible Infrared Imaging Radiometer Suite) on the Suomi NPP satellite on September 22. In this image, an elongated stream of water vapor—the hallmark of atmospheric rivers—had reached the west coast of North America after crossing the Pacific from Southeast Asia. When atmospheric rivers encounter land, they often release that water vapor in the form of rain or snow.
</p><p>Areas along the coast of British Columbia and southeast Alaska saw days-long stretches of significant precipitation. In the town of Bella Bella, British Columbia, between 50 and 100 millimeters (2 and 4 inches) of rain fell each day from September 21 to 24. Rainfall totals in Yakutat, Alaska, topped 25 millimeters (1 inch) on September 23 and 24.
</p><p>The ribbon of clouds delivering precipitation to the region was still visible on September 24, when NASA’s EPIC (Earth Polychromatic Imaging Camera) imager on the DSCOVR (Deep Space Climate Observatory) satellite captured an image (below) from about 1 million miles above Earth.
</p><p>In 2019, scientists established a scale to classify atmospheric rivers based on their maximum intensity and duration. Similar to the Saffir-Simpson wind scale for hurricanes and the Enhanced Fujita scale for tornadoes, it is meant to help communicate potential storm effects to the public and distinguish between hazardous and more-beneficial events. (Atmospheric rivers bring replenishing rains and contribute to winter snowpack, particularly in the western United States.)
</p><p>The storm shown here made landfall as a Category 5 atmospheric river—the highest tier on the scale—near Bella Bella and at progressively lower intensities to the north and south. Prior to making landfall, the system’s overall intensity was much higher.
</p><p>Preliminary estimates indicate that this was an uncommonly strong event, said scientists affiliated with the Center for Western Weather and Water Extremes at the University of California, San Diego. An initial calculation of integrated water vapor transport (IVT)—a measure combining wind speed and moisture levels in the atmosphere—found anomalously high values in this system compared with other atmospheric rivers in the north Pacific in the past 23 years.
</p><p>“The extremity of the Gulf of Alaska atmospheric river IVT is remarkable,” said Bin Guan, an atmospheric scientist at NASA’s Jet Propulsion Laboratory and the University of California, Los Angeles. The days leading up to the event saw the development of a strong Arctic Oscillation in its negative phase, he said. Such low values are extremely rare for September but can be conducive to atmospheric rivers in this region. “This could be one of the conditions that potentially contributed to this exceptionally strong atmospheric river event,” Guan said.
</p><p>This storm system was expected to bend south late on September 24, according to news reports. However, more unsettled weather was forecast along the coast in the ensuing days, bringing less rain but high winds.
</p>
NASA Earth Observatory images by Michala Garrison, using VIIRS data from NASA EOSDIS LANCE, GIBS/Worldview, and the Suomi National Polar-orbiting Partnership and data from DSCOVR EPIC. Story by Lindsey Doermann.
Photo by NASA Earth Observatory images by Michala Garrison

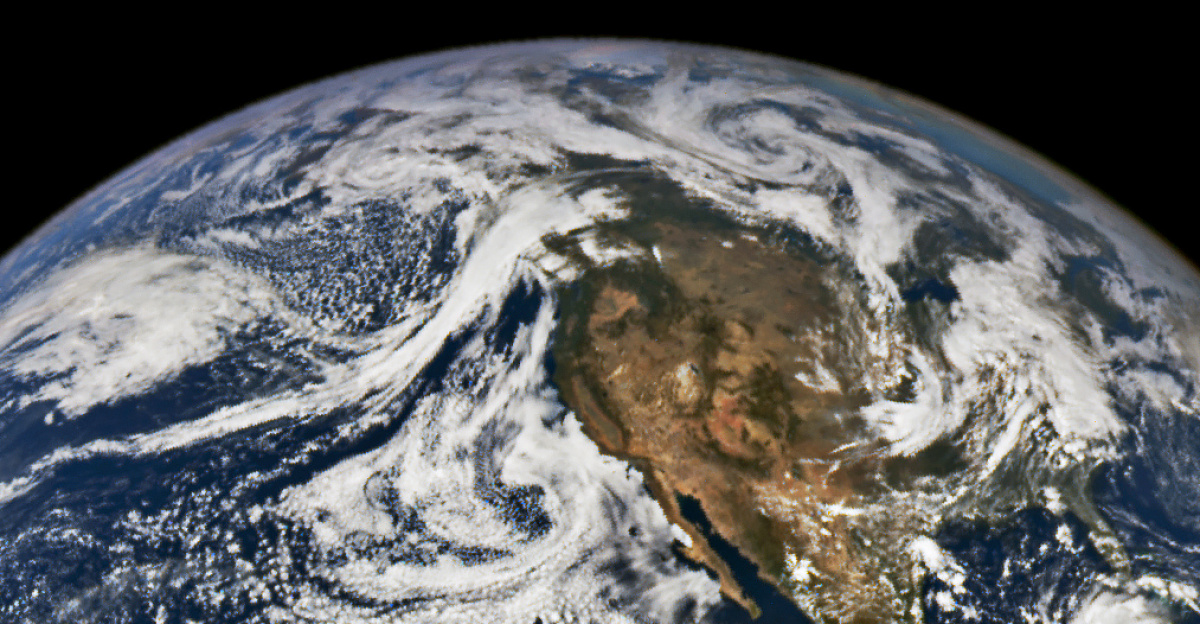
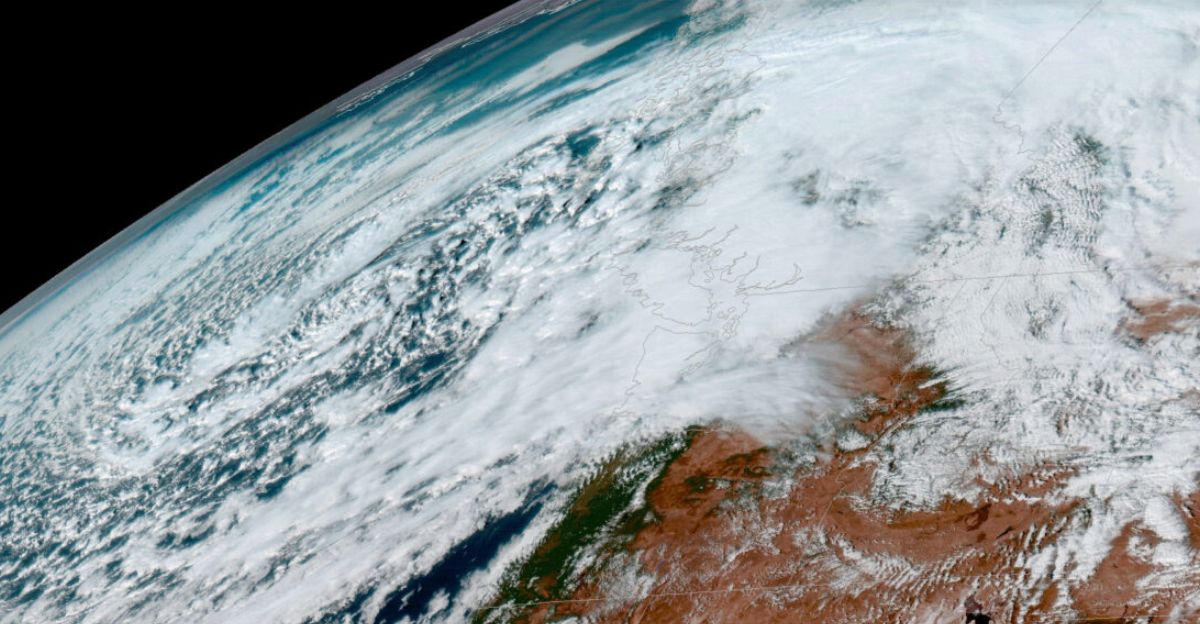
NASA tracking shows this atmospheric river stretching nearly 11,000 kilometers, tapping unusually warm Pacific waters. Warmer oceans allow the system to “load” with moisture before landfall.

As the moisture-rich air slams into Western mountain ranges, it rises, cools, and condenses—producing heavy rain at lower elevations and intense snowfall above roughly 6,000 to 8,000 feet.

Snow Levels Collapse

snow covered mountain during daytime
Photo by Sophia Simoes on Unsplash

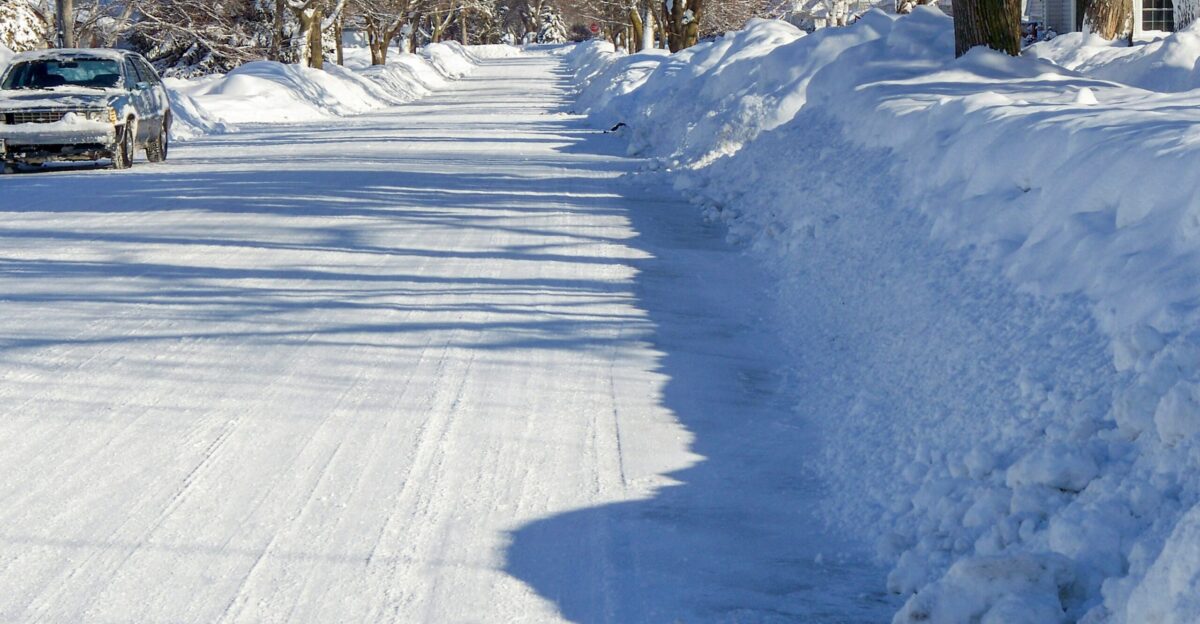
Forecasts show snow levels dropping sharply as the storm cools. Early in the event, snow falls above 8,000–9,000 feet, but by Christmas Day levels descend to around 6,000 feet.

This shift means snow impacts spread beyond high peaks to roads, parking lots, and lower-elevation highways, expanding disruption across a much broader geographic region than typical mountain storms.

Caltrans’ Enforcement Dilemma

Broken tree limbs following the North American blizzard of 2010 lying in a Dupont Circle park at the intersection of 20th Street Q Street and Connecticut Avenue N W in Washington D C Shops located on the 1600 block of Connecticut Avenue N W are visible in the background
Photo by AgnosticPreachersKid on Wikimedia

Caltrans must escalate chain controls as conditions worsen. R-1 applies to commercial vehicles, R-2 expands requirements to most passenger cars, and R-3 mandates chains on all vehicles without exception.

R-3 is rare and signals extreme danger. Officials may also close highways entirely, weighing access against safety while knowing that misjudgments can lead to serious accidents.

Truck Screening Protocols

A yellow truck among snowy urban streets surrounded by buildings and winter scenery
Photo by Efrem Efre on Pexels

At mountain checkpoints like Applegate on I-80, Caltrans screens commercial trucks for chain compliance. Drivers without required equipment are turned back to lower elevations.

The policy reflects decades of crash data showing under-equipped trucks jackknife and block highways during storms. While screening prevents catastrophic pileups, it also creates long holiday backups.

The Cost-Benefit Calculation

Aerial photograph capturing a snow-covered suburban neighborhood with visible houses and a pool.
Photo by Kelly on Pexels

Every delayed vehicle represents frustration and economic cost. Yet each accident prevented avoids far greater disruption, injury, and emergency response demands.

Caltrans data shows that removing chain-inadequate vehicles prevents cascade failures where a single disabled truck shuts down an entire corridor, amplifying delays across regions.

Limits of Forecast Precision

A car drives on a snowy road surrounded by trees during a snowstorm creating a wintry scene
Photo by Chris Peeters on Pexels

Confidence is high in the storm’s arrival and severity, but snowfall totals at high elevations still carry ±1–2 foot uncertainties. Atmospheric rivers remain difficult to model under extreme conditions.

Warmer air can suppress snowfall—or intensify it unexpectedly. Experts caution against relying on single numbers, noting that overconfidence in forecasts can drive risky decisions.

The Waiting Question

Heavy snowfall seen at Pershing Square Manhattan New York during Winter Storm Jonas January 23 2016
Photo by Danazar on Wikimedia

As Christmas approaches, travelers face a narrowing decision window: drive, fly, or stay put. AAA expects most will still drive despite warnings.

Airlines report near-capacity flights on December 24–25, suggesting many have already committed. For those undecided, weather windows may close within 48 hours.

The Climate Undercurrent

Winter storm at Shuswap Lake.
Photo by The Cosmonaut on Wikimedia

Scientists link intensifying atmospheric rivers to warming oceans and air. A 2025 study concluded these systems are becoming “bigger, wetter, and more frequent.”

The December 2025 storm reflects that trend, with tropical moisture pushing northward and snowfall rates exceeding historical expectations. Researchers stress this is not anomalous.
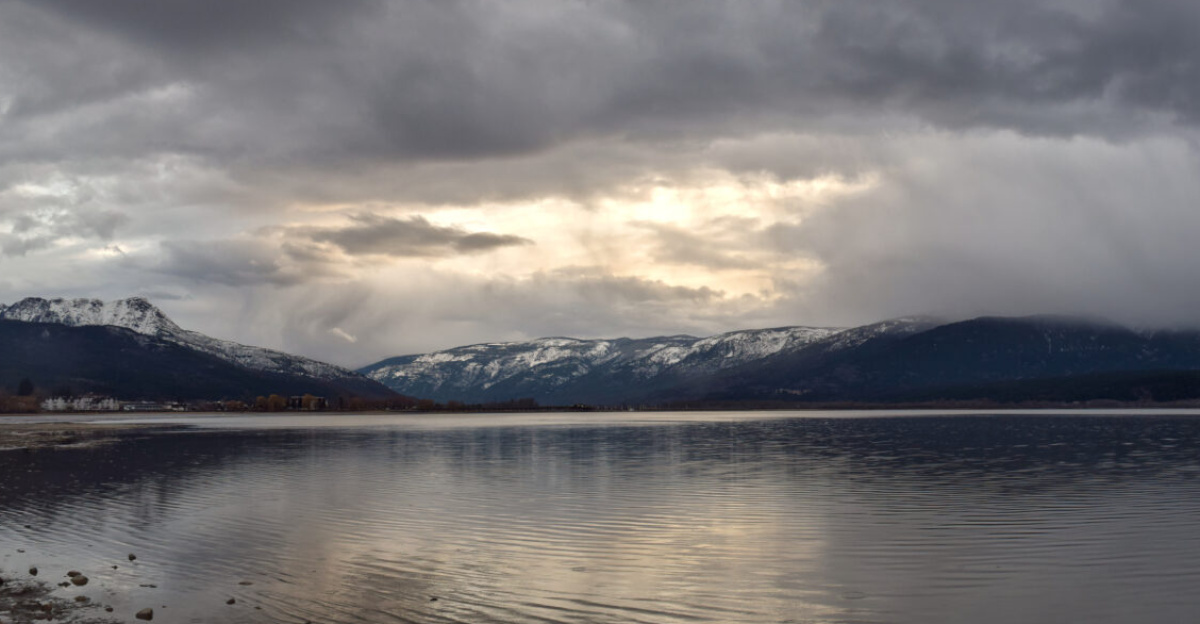
A Global Pattern

In mid-November 2022 frigid air swept across Lake Erie and Lake Ontario triggering a long-duration lake effect snow event that dropped record snowfall in parts of western New York The first snowflakes fell on November 16 with formation of high-intensity bands of snow following soon after On November 19 the Buffalo Airport reported a record snowfall of 17 2 inches for that date-handily beating the previous record of 7 6 inches which fell on the same date in 2014 By that time Orchard Park south of Buffalo was shivering under a monumental 77 inches of fresh snow The snow came with a price snarling traffic and dropping visibility to less than a half-mile at times Media reported at least two deaths due to the storm and more than 200 people requiring emergency service response or rescue On November 21 as falling flakes began to disappear and the skies to clear the National Weather Service tabulated totals for the storm while residents living in the heaviest bands continued to dig out The town of Hamburg just south of Buffalo won the prize for the deepest snow measuring-in at 81 inches Nearby Orchard Park was next in line with a storm total of 80 inches Meanwhile Tonawanda a northern suburb of Buffalo registered a relatively-sparse 12 1 inches Such wide differences in snow accumulation are common in lake-effect snow due to the formation of snow bands that can be relatively narrow The Moderate Resolution Imaging Spectroradiometer MODIS on board NASA s Terra satellite acquired a true-color image of the aftermath of the snowstorm on November 21 as skies began to clear Clouds remain heavy in the west and over Lake Ontario while sediment swirls in Lake Erie Snow accumulation is heaviest in a ring around Lake Erie especially in the northeast Lake-effect snow occurs along the eastern edge of the Great Lakes when icy wind blows across the lakes from Canada The wind picks up relatively warm moist air over the lakes and pushes it over land where the air is cooler When the moist air encounters cooler temperatures over land the water condenses into precipitation which in cold temperatures falls as snow
Photo by MODIS Land Rapid Response Team NASA GSFC on Wikimedia

Often called a “Pineapple Express,” this system extends into Canada, with British Columbia issuing its own warnings. Similar atmospheric rivers drive seasonal flooding in Japan and New Zealand.

Weather patterns increasingly operate at planetary scale. North American storms are now tightly linked to global ocean dynamics, making regional isolation-based planning obsolete.

Infrastructure Stress Test

a snow covered field
Photo by Yohan Marion on Unsplash

Utilities brace for power outages as wet snow weighs down trees and power lines. California water agencies, despite dry conditions, fear flooding due to saturated soils.

Landslides and spillway strain remain risks. The challenge is systemic: transportation, power, water, and emergency services face simultaneous stress during peak travel.

The Broader Conversation

a couple of trucks driving down a snow covered road
Photo by Koy Gregerson on Unsplash

December 2025 illustrates a recurring dilemma. Travel demand is breaking records just as extreme weather grows more dangerous and unpredictable.

Forecasting improves but never eliminates uncertainty. Each winter now brings variations of this collision, forcing societies to reconsider mobility, infrastructure, and risk in a changing climate.

Sources:
AAA Year-End Holiday Travel Forecast, Published: December 10, 2025
National Weather Service Hanford – Yosemite Winter Storm Warning, Issued: December 21, 2025
NASA Global Precipitation Measurement (GPM) – Atmospheric Rivers Tracking, Published: December 17-22, 2025
Center for Western Weather and Water Extremes (CW3E) – AR Update December 22, 2025, Published: December 22, 2025
Newsweek – Winter Weather Warning (40 Inches Snow), Published: December 21, 2025