For the first time, researchers have assembled a complete digital picture of the world’s built environment, mapping every recorded building on Earth in three dimensions. The GlobalBuildingAtlas, created at the Technical University of Munich (TUM) with the German Aerospace Center (DLR), catalogs 2.75 billion structures from 2019 satellite data, turning scattered local datasets into a single global view of how people construct and inhabit space.
A team led by Professor Xiaoxiang Zhu, Chair of Data Science in Earth Observation at TUM, drove the effort. Drawing on expertise in satellite sensing, artificial intelligence, and geospatial analysis, the group developed machine learning models capable of scanning planetary-scale imagery for building traces. By fusing optical and radar data, their algorithms detect footprints and estimate heights, then convert raw pixels into consistent 3D building blocks. The result is the first comprehensive global inventory of buildings, covering cities, suburbs, and remote rural settlements in a uniform way.
Global coverage in 3D
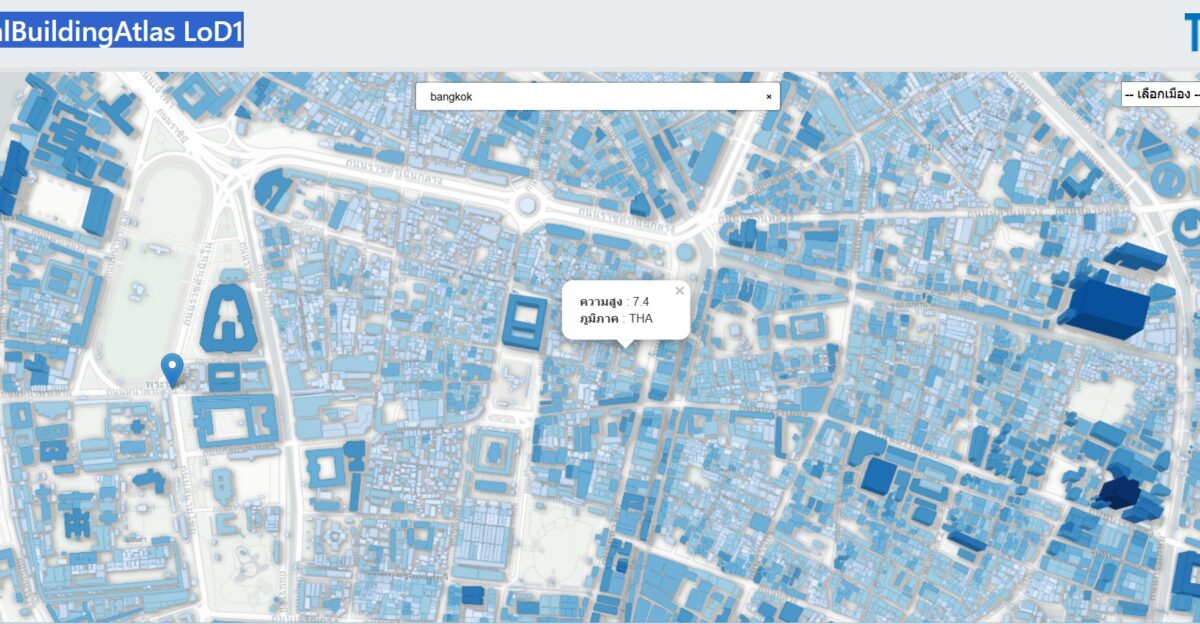
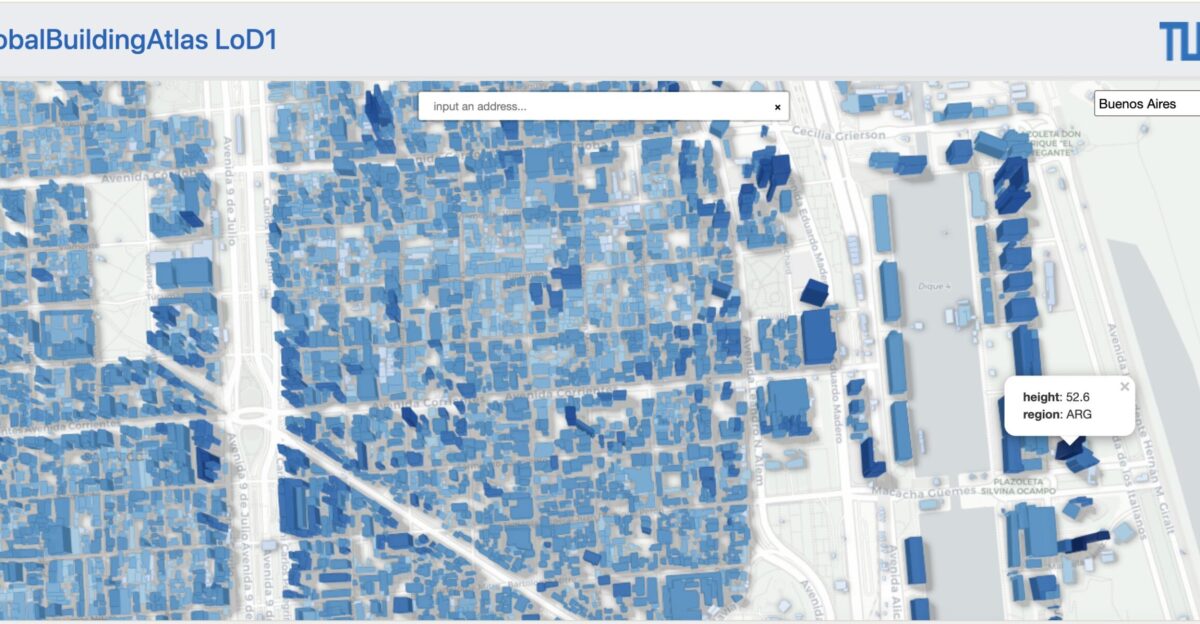
The GlobalBuildingAtlas provides Level of Detail 1 (LoD1) models for each of the 2.75 billion buildings. In practice, this means every structure appears as a simple 3D block defined by footprint and uniform height, without intricate roof shapes or façade elements. About 97 percent of the atlas uses this extruded-block representation, which is intentionally streamlined to keep processing and analysis feasible on a planetary scale.
The dataset is open access and has been published through platforms such as GitHub and research data repositories, allowing scientists, public agencies, and private organizations to download and work with it. Because the data are globally consistent, users can compare building patterns across regions and countries using the same metrics. That consistency is critical for applications ranging from climate modeling and disaster risk assessment to urban planning and infrastructure design.
Bringing the “missing billion” into view
Before this work, the best available global building products listed around 1.7 billion structures. That left a shortfall of more than one billion buildings, many of them in under-mapped regions of Africa, South America, Southeast Asia, and rural areas worldwide. These gaps meant that entire communities were effectively invisible in large-scale planning tools.
The GlobalBuildingAtlas adds roughly 1.05 billion previously unmapped buildings, sharply reducing this digital blind spot. The project’s 3×3 meter spatial resolution—about 10×10 feet—represents a 30-fold increase in detail compared with earlier global building maps. At that level of precision, analysts can distinguish basic forms such as detached houses, multi-story apartment blocks, and large industrial facilities. This finer resolution allows for more accurate estimates of building volume and density, which in turn support better evaluations of infrastructure needs and exposure to hazards.
By incorporating these additional structures, the atlas effectively brings an estimated 3–4 billion people into detailed digital planning frameworks for the first time. Communities that were previously left out of global datasets can now be included in assessments of housing, services, and vulnerability.
From flat footprints to volumetric insight
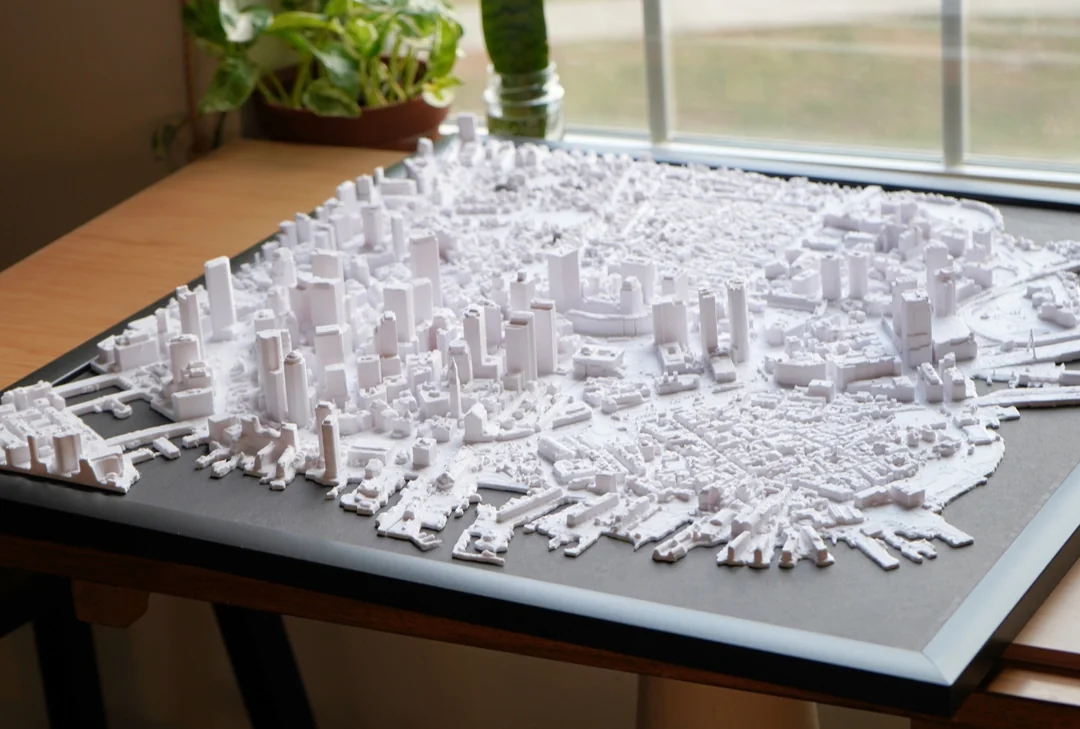
Earlier building datasets were largely two-dimensional: they showed where structures sat on the ground but said little about their vertical extent. The switch to 3D LoD1 models changes what can be inferred from the data. With approximate height and volume available for each building, planners and researchers can estimate living space, built mass, and potential infrastructure capacity at neighborhood or city scale.
One of the project’s key analytical tools is “building volume per capita,” a measure comparing total built volume to the size of the local population. Low values may indicate overcrowding or underdevelopment, suggesting that many residents share limited space. High values are often associated with more spacious and better-resourced environments. When mapped globally and combined with socio-economic indicators, this metric highlights structural inequalities that simple footprint counts cannot reveal, including the constrained conditions in informal settlements and the relative abundance in wealthier districts.
These volumetric data also support climate and energy research. Buildings account for a large share of global energy demand, especially for heating, cooling, and lighting. With 3D models, climate scientists can better estimate how different districts might respond to rising temperatures, heat waves, or changing weather patterns. Compact low-rise areas with little shading will experience heat stress differently from high-rise zones with more shadow and air flow. The dataset also gives researchers a basis for linking building stocks to local energy use and associated carbon emissions, helping identify where efficiency upgrades or new standards could have the greatest effect.
Open data for risk, resilience, and planning

Disaster risk agencies can overlay the 3D building data with maps of floods, earthquakes, cyclones, or landslides to estimate how many structures and people may be exposed to specific hazards. This supports more realistic scenario modeling, from potential damage levels to evacuation planning and shelter capacity. The German Aerospace Center is exploring how to integrate the atlas into the International Charter Space and Major Disasters, which coordinates satellite support after major events. Having a pre-existing global building layer could speed up damage assessment and targeting of relief efforts.
Urban planners are using the atlas to compare city forms and test development scenarios. Because the data cover the entire planet in a standard format, fast-growing cities can benchmark themselves against places that have already undergone similar transitions, examining density patterns, infrastructure provision, and land use. The same dataset can highlight where services such as water, electricity, transport, or health facilities lag behind the distribution of people and buildings, guiding investment toward areas of greatest need.
The GlobalBuildingAtlas is the product of substantial public investment, including support from an ERC Starting Grant, an EU program backing early-stage, high-risk research. By releasing the resulting data openly rather than restricting it to a small circle of specialists, the project aims to make this new level of spatial insight available to governments, humanitarian organizations, businesses, and citizen analysts worldwide. As more users combine the atlas with demographic, economic, and environmental information, it is likely to underpin new tools for monitoring inequality, planning climate adaptation, managing emissions, and designing more resilient settlements. The digital map of Earth’s buildings is a snapshot from 2019, but its implications will shape how societies plan and respond to change in the years ahead.
Sources
TUM press release – All the world’s buildings available as 3D models for the first time
GlobalBuildingAtlas GitHub repository (data and code)
Global Building Atlas entry in the Earth Engine community catalog
Scientific dataset paper in Earth System Science Data (building polygons and heights)
Interesting Engineering article – high‑resolution 3D map of Earth’s buildings