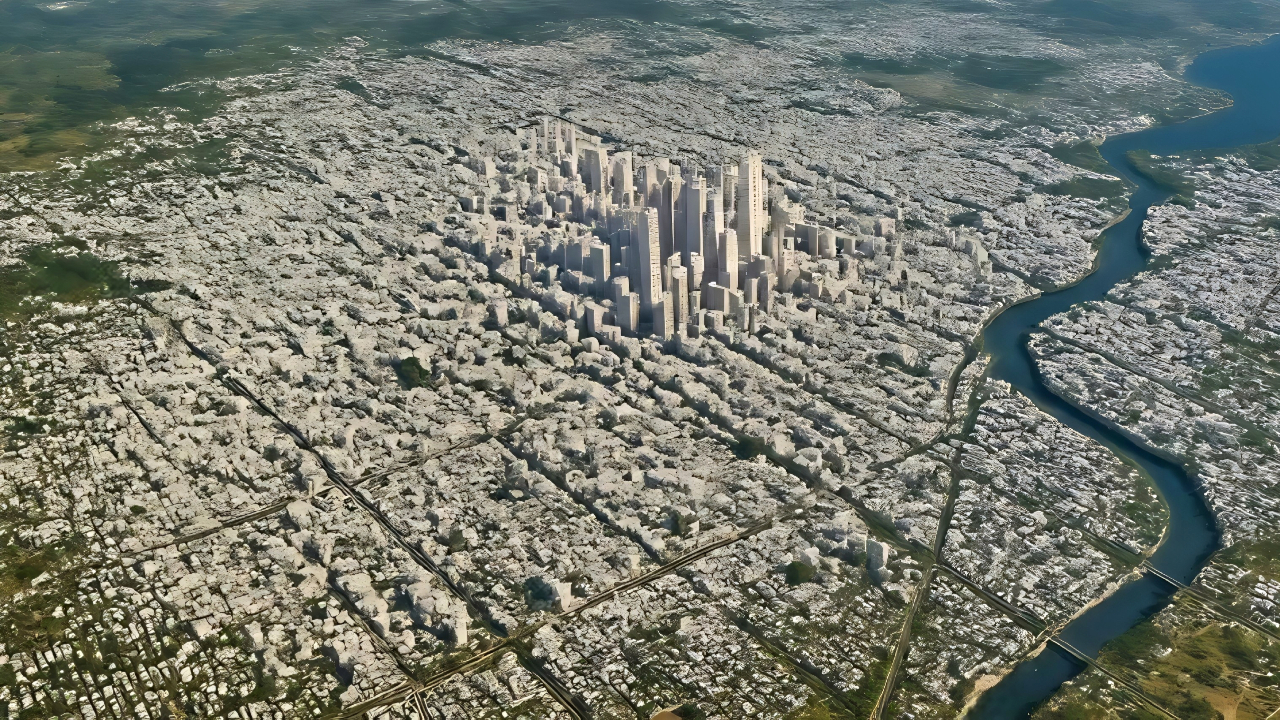
For the first time in human history, scientists have created a complete digital map of every building on Earth. Researchers at the Technical University of Munich have unveiled the GlobalBuildingAtlas, a groundbreaking 3D map containing 2.75 billion buildings captured from satellite imagery in 2019.
This achievement represents a 30-fold improvement in detail compared to all previous global building maps combined. The atlas transforms our fragmented understanding of global construction into one coherent picture showing how and where 7.8 billion people live, work, and build their communities.
The Brilliant Team Behind the Atlas

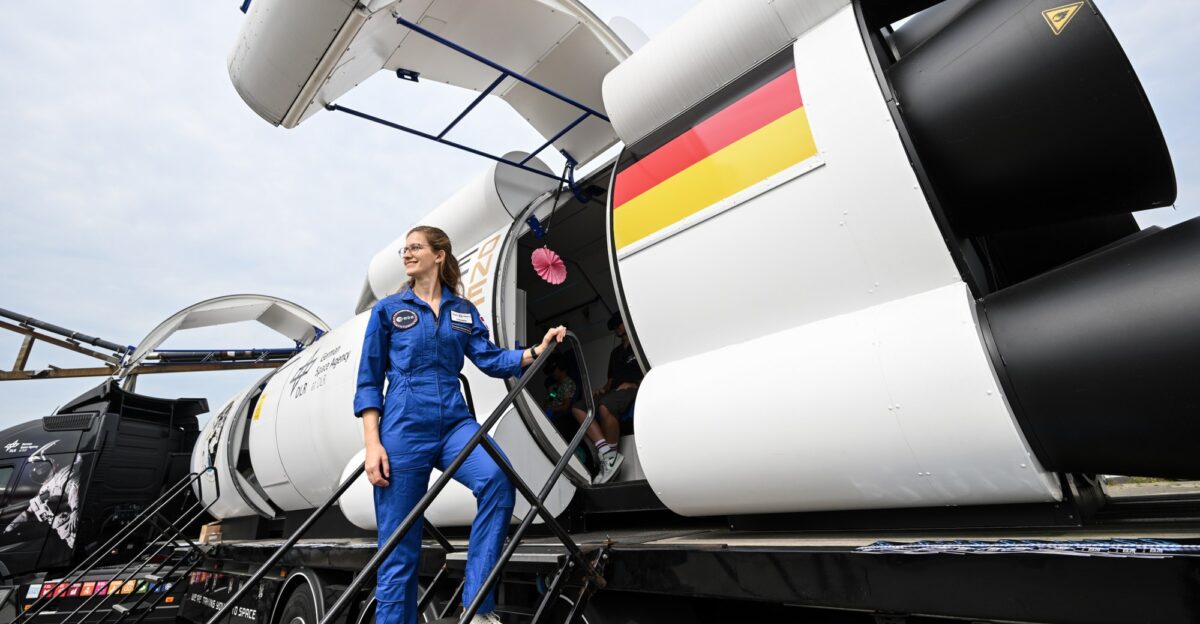
Professor Xiaoxiang Zhu leads the groundbreaking project as Chair of Data Science in Earth Observation at TUM. Her multidisciplinary team combines expertise in satellite imagery, artificial intelligence, and geospatial mapping to accomplish what once seemed impossible. Working closely with the German Aerospace Center (DLR), they developed advanced machine learning algorithms capable of analyzing planetary-scale satellite data.
The team transformed raw satellite pixels into structured 3D building models, processing enormous amounts of information to create the world’s first truly comprehensive global building inventory. Their innovation demonstrates how cutting-edge technology can solve humanity’s biggest information challenges.
Understanding the Global Building Atlas
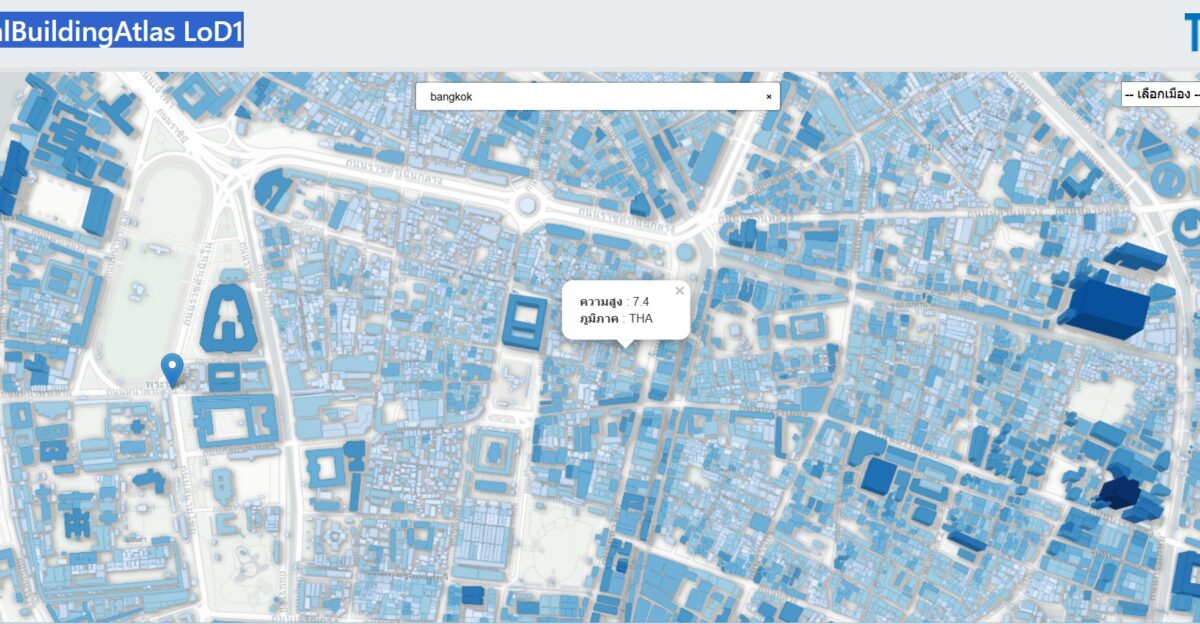
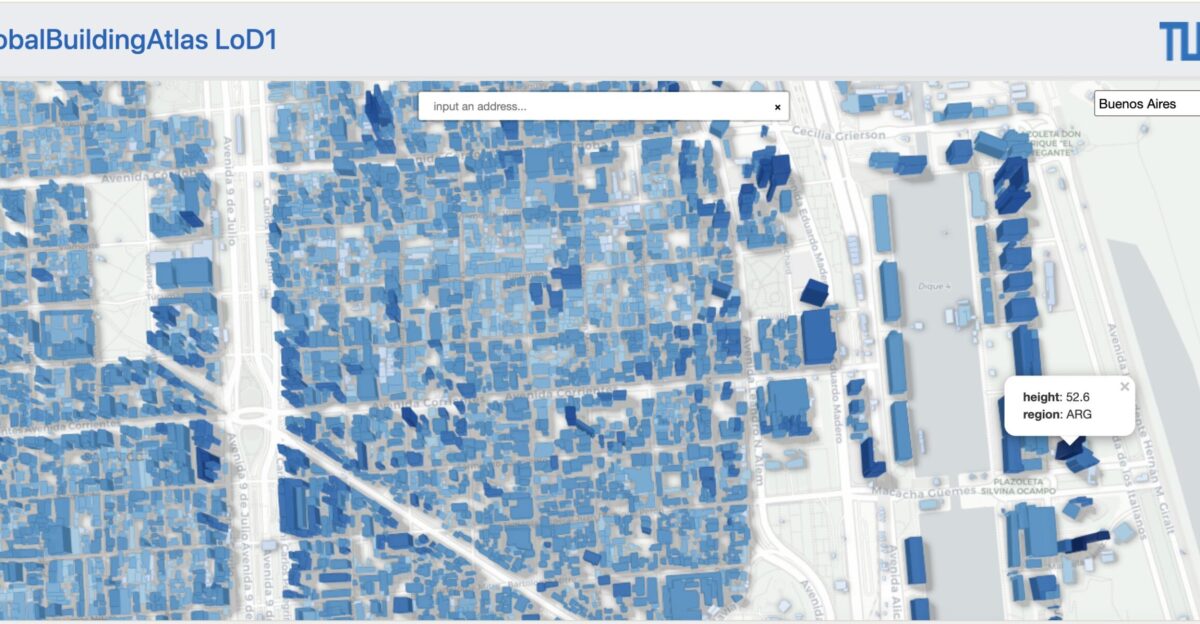
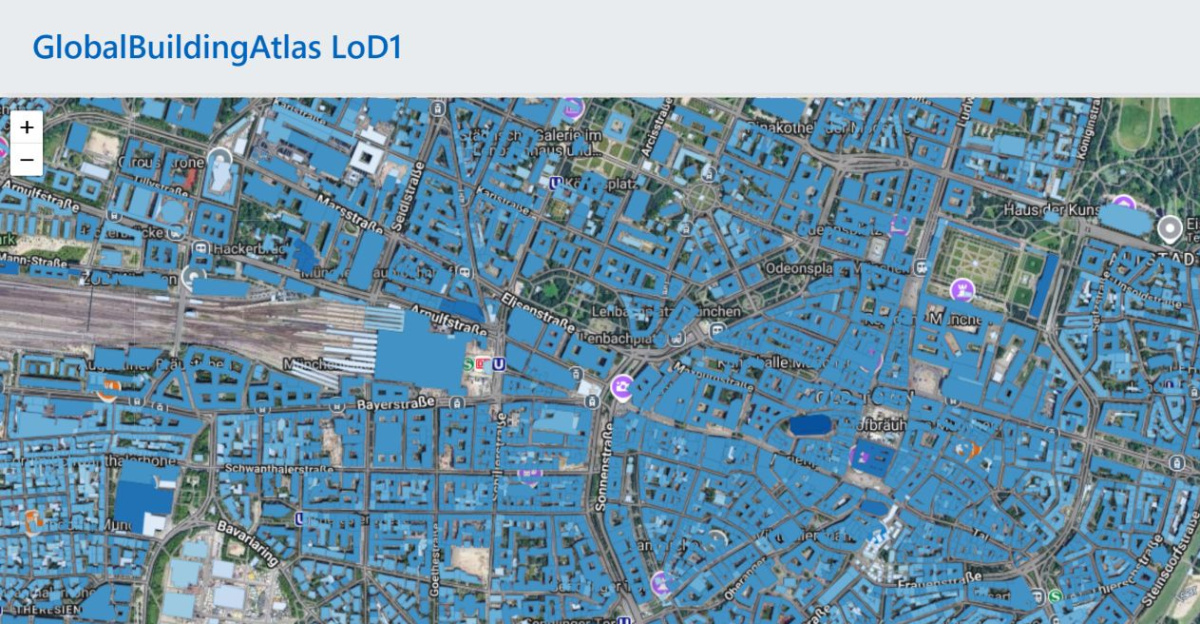
The GlobalBuildingAtlas is an open-access 3D dataset providing detailed models for 2.75 billion buildings worldwide. Each building is represented as a Level of Detail 1 (LoD1) model, essentially a simple 3D block that captures the building’s footprint and height. Instead of keeping this valuable data locked away, researchers made it freely available through platforms like GitHub and research data portals.
Scientists, urban planners, government agencies, and even private companies can access the atlas to inform decisions about disaster response, infrastructure investment, climate resilience, and sustainable development.
Finding the Missing Billion
Before the GlobalBuildingAtlas, the best available global maps contained only about 1.7 billion recorded buildings. This staggering gap meant that more than one billion structures, entire communities in Africa, South America, Southeast Asia, and rural regions, were essentially invisible in global data.
The atlas adds roughly 1.05 billion previously unmapped buildings to the digital record, bringing hundreds of millions of people into detailed planning frameworks for the first time. This visibility matters enormously when planning disaster response, infrastructure investment, or climate adaptation strategies.
The 3×3 Meter Resolution Breakthrough
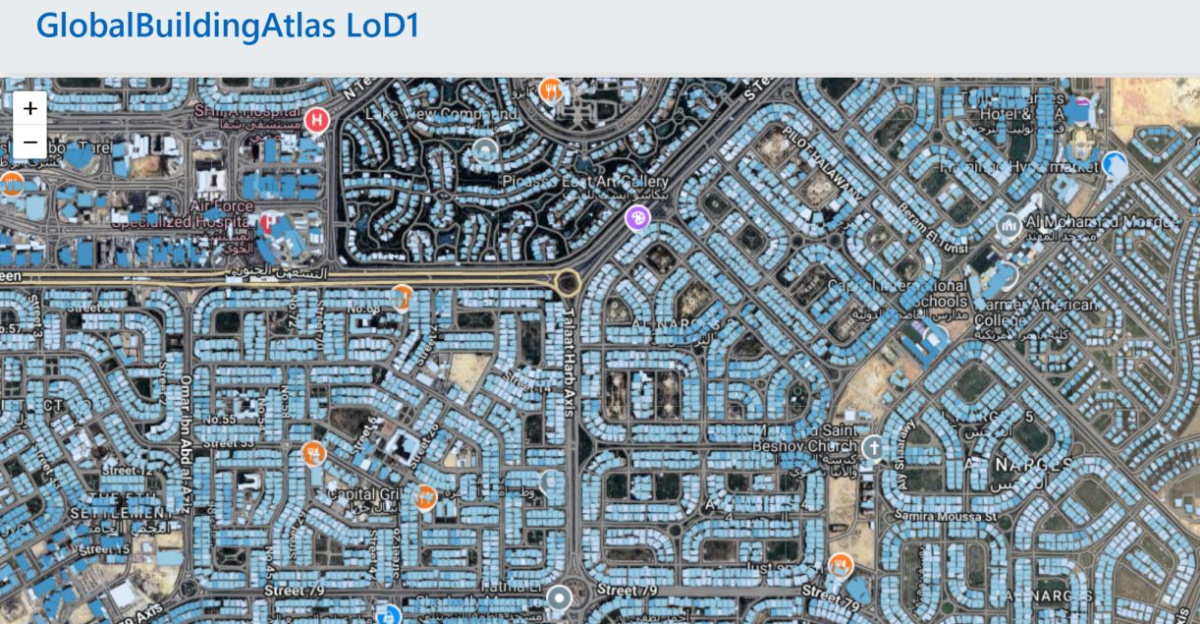
The atlas models each building at approximately 3×3 meters (about 10×10 feet) spatial resolution. This precision is 30 times finer than previous global building products, enabling researchers to capture basic building geometry, estimate height, and calculate volume with remarkable accuracy.
At this resolution, analysts can distinguish between a single-story home, a multi-story apartment building, and a sprawling factory from satellite imagery alone. This breakthrough opens entirely new possibilities for studying urban density, mapping exposure to natural hazards, and analyzing infrastructure capacity.
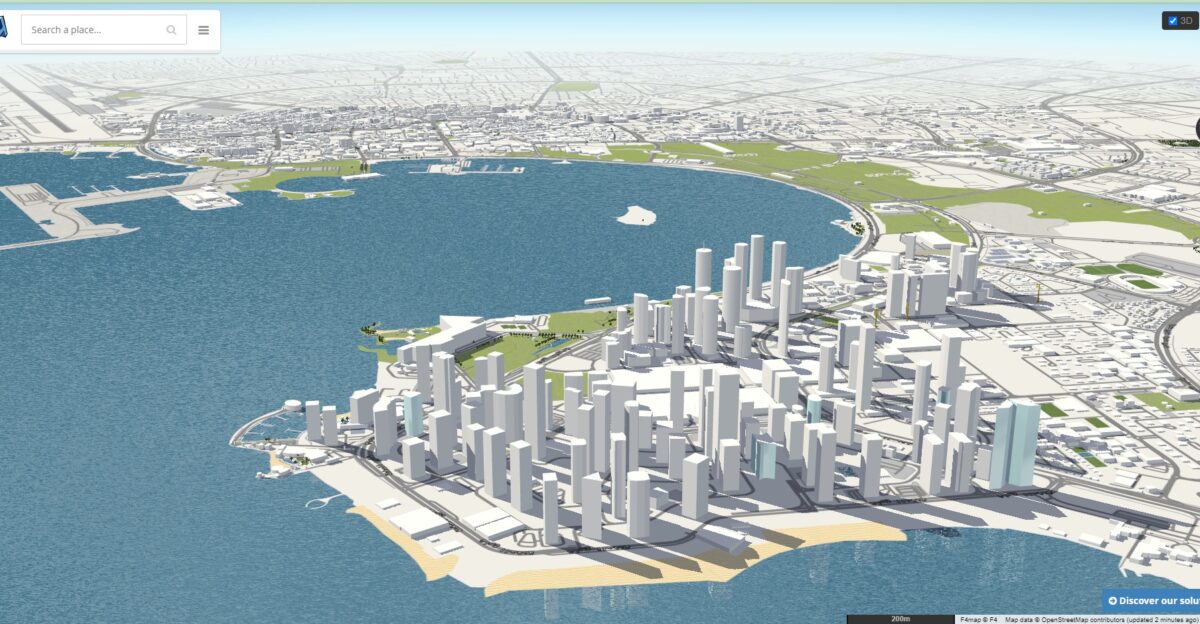
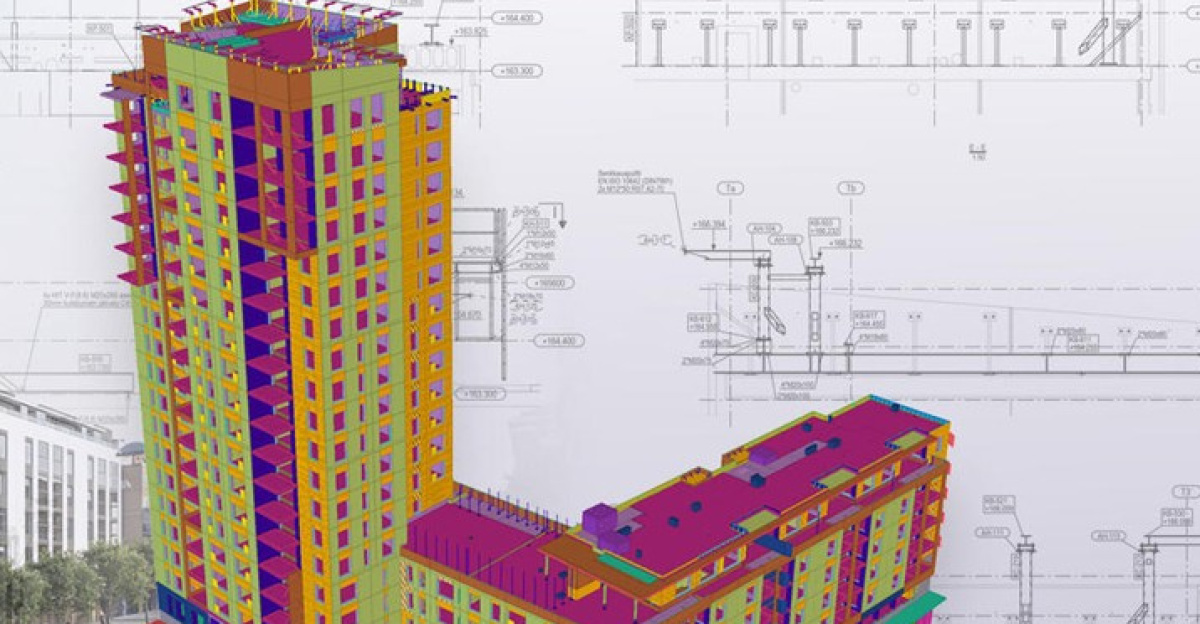
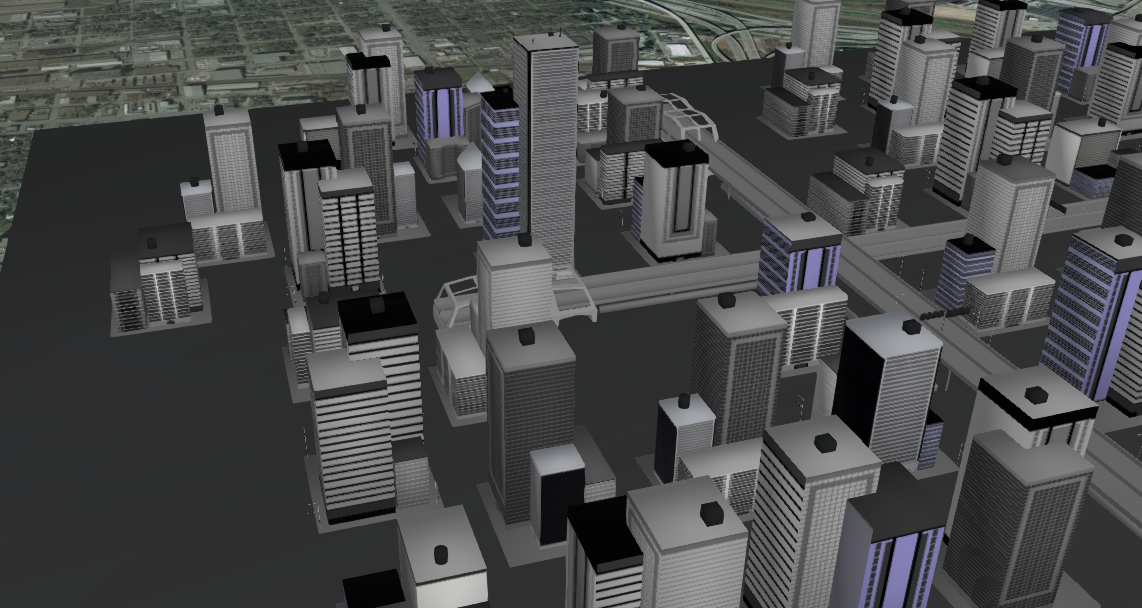
Going from Flat Maps to 3D Reality
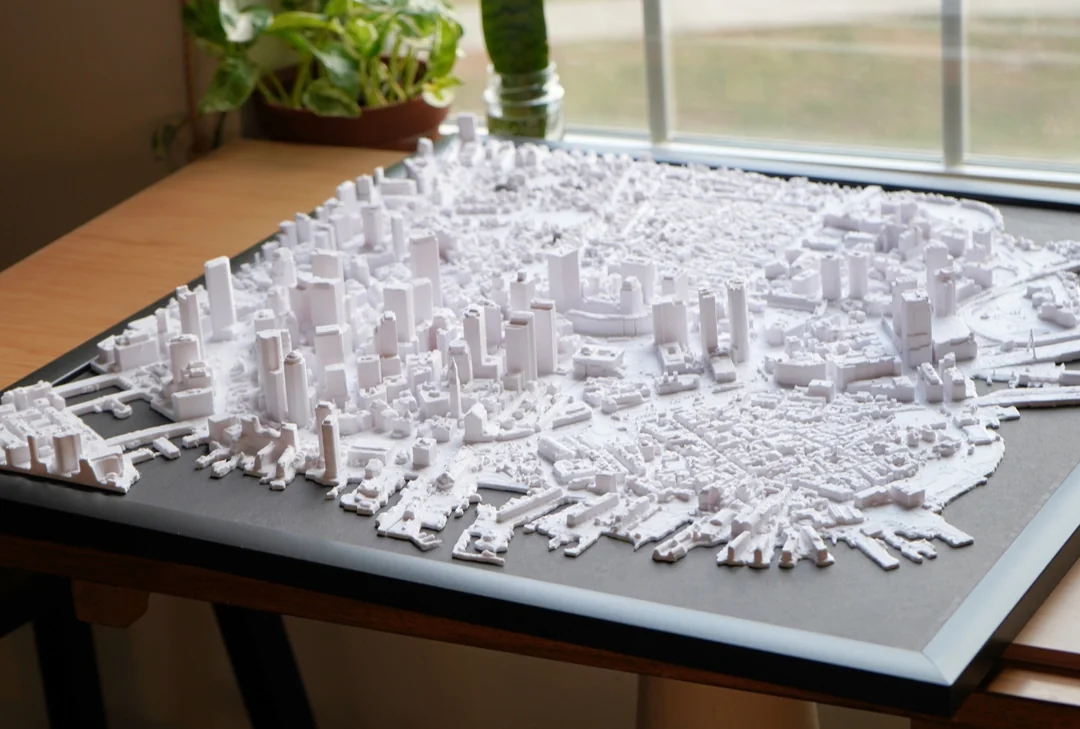
Traditional building maps showed only 2D footprints, where buildings exist on the ground but not their size vertically. The GlobalBuildingAtlas revolutionizes this by providing 3D LoD1 models that capture both footprint and height information. This shift from flat to volumetric data is profound.
Planners can now approximate living space, calculate built mass, and estimate infrastructure capacity for individual buildings. A researcher can identify slum areas with tightly packed, low-volume structures versus wealthy neighborhoods with expansive buildings. Climate scientists can estimate heating and cooling needs more accurately.
Understanding LoD1
LoD1 (Level of Detail 1) represents buildings as simple extruded blocks with uniform height, think of arranging LEGO blocks to show a city’s skyline. Approximately 97 percent of the GlobalBuildingAtlas uses this simplified approach rather than detailed rooflines or architectural facade details.
This simplicity is actually a feature, not a limitation. Simple models are computationally efficient, making global analysis feasible.
Eyes in the Sky

Creating the atlas required combining optical and radar satellite imagery captured in 2019 with advanced machine learning algorithms. Optical satellites photograph Earth’s surface like a camera, while radar penetrates clouds to measure surface features.
Researchers fed this combined imagery into AI systems trained to recognize building footprints and estimate heights using stereo vision or radar signals. The algorithms validate detected buildings and aggregate billions of individual observations into one coherent global dataset.
How Breaking Research Gets Funded
The GlobalBuildingAtlas received support from an ERC Starting Grant, a prestigious European Union program designed specifically to fund innovative research ideas in early stages. This funding was crucial. It enabled the team to access high-quality satellite data, powerful computing infrastructure, and the multidisciplinary expertise needed to process planetary information consistently.
Creating a global building map would be impossible with traditional research budgets. The ERC Starting Grant recognizes breakthrough ideas with the potential to transform their fields. By investing in ambitious projects like this, funding agencies enable researchers to tackle challenges too large for conventional approaches, ultimately benefiting society through open-source knowledge and tools.
Bringing Light to Digital Darkness
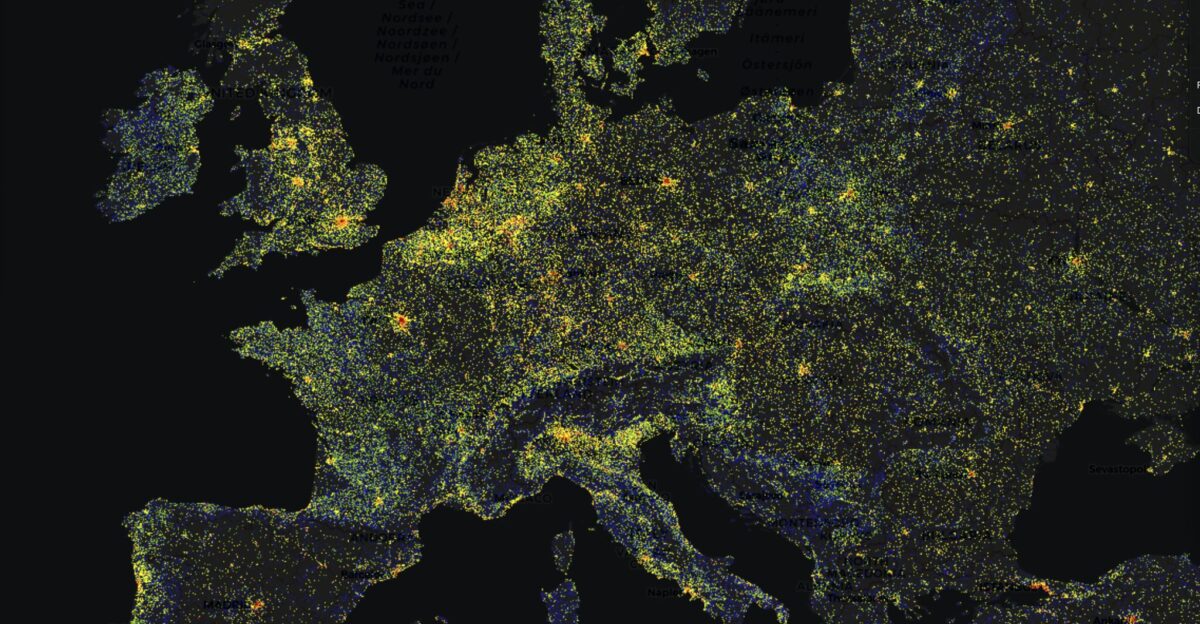
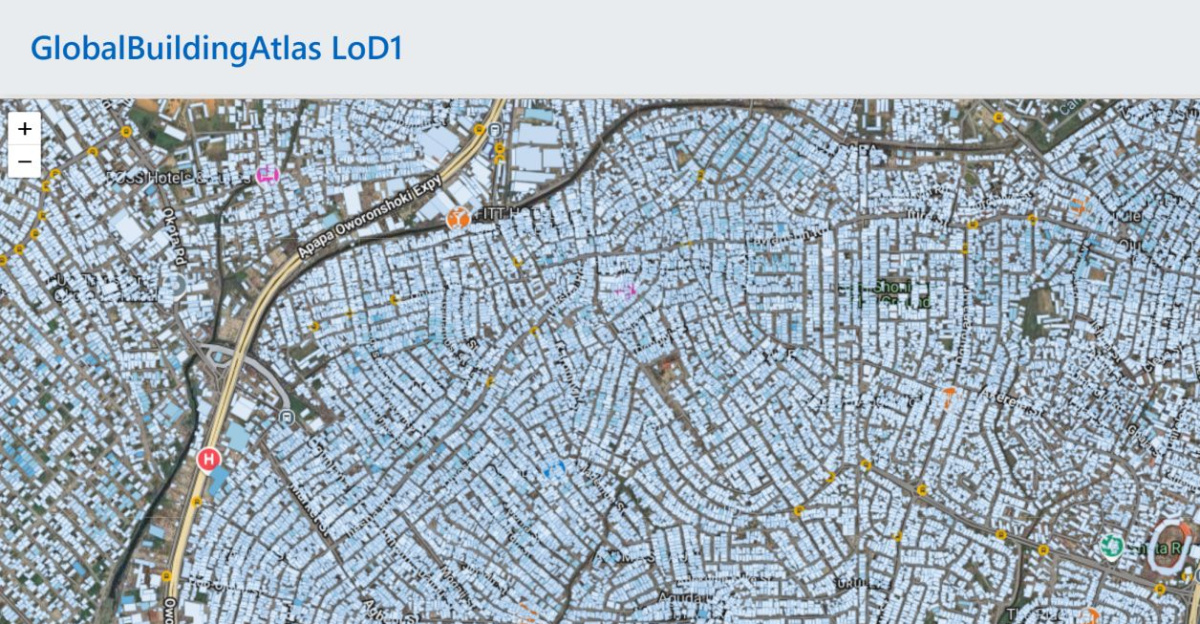
Earlier global building maps significantly underrepresented Africa, South America, Southeast Asia, and rural regions worldwide. Entire continents appeared largely empty on digital maps despite housing hundreds of millions of people. This digital darkness had real consequences: communities not represented in maps tend to be overlooked in policy decisions and international development.
The GlobalBuildingAtlas systematically maps buildings in these neglected regions, bringing them into global datasets for the first time. Slums and informal settlements become visible. Rural communities appear in planning frameworks.
Billions of People Enter Global Planning
By mapping over one billion previously unmapped buildings, the atlas effectively brings 3–4 billion people into detailed digital planning frameworks for the first time. This is more than a data achievement; it’s a humanitarian one. When communities appear in maps and datasets, they become eligible for infrastructure investment, disaster preparedness planning, and development initiatives.
Being absent from global data often meant being excluded from international policy conversations. Now, with the GlobalBuildingAtlas, isolated rural villages, rapidly expanding urban slums, and remote communities have digital representation. This visibility matters for everything from disaster response to infrastructure investment.
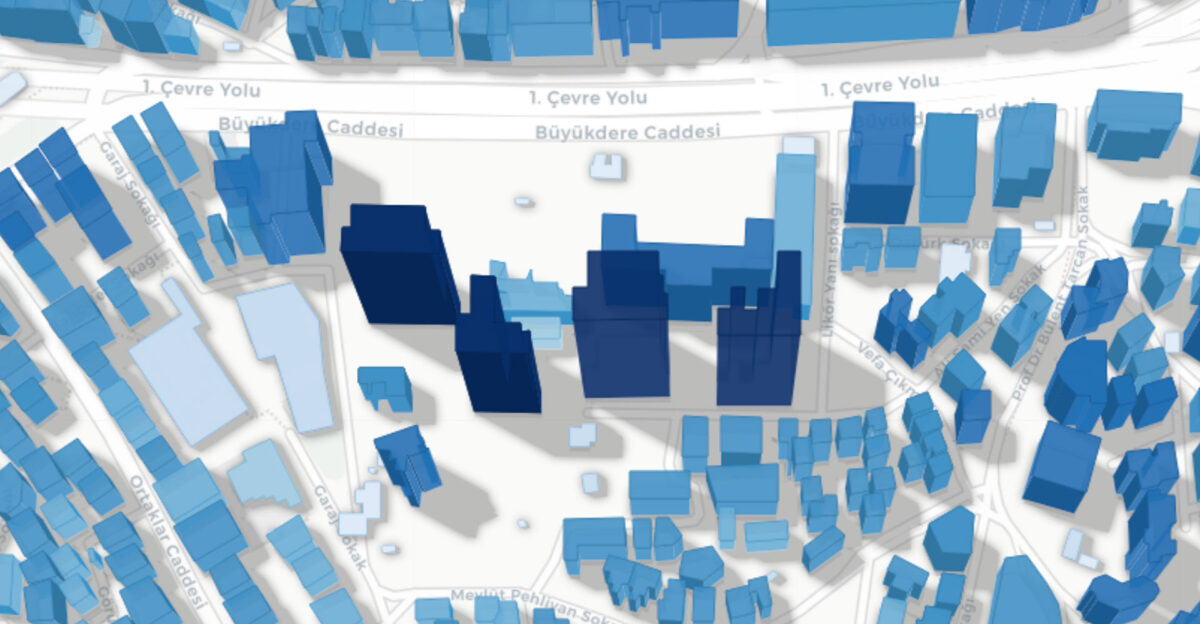
Building Volume Per Capita
One of the atlas’s most powerful innovations is introducing building volume per capita, a metric measuring total building volume relative to population size. This simple concept reveals stark inequalities invisible in traditional maps. Low volume per person often indicates overcrowding or underdevelopment, suggesting people living in cramped conditions.
High values reflect wealthier environments with spacious buildings and room to spare. By mapping this metric globally, researchers can identify areas where residents are structurally disadvantaged: more people forced into smaller buildings than their peers elsewhere. When combined with socio-economic data, building volume per capita becomes a powerful indicator of living conditions and inequality.
Reading Inequality in 3D Building Data
When building volume per capita is mapped globally, stark patterns emerge that 2D footprints could never reveal. Dense urban slums with high populations and low building volumes appear dramatically different from wealthy districts. Informal settlements become visible as areas where residents are structurally disadvantaged, forced to live in insufficient built space.
Planners can now correlate volumes with socio-economic data to infer living conditions and identify communities requiring infrastructure investment. Urban planners gain tools for understanding human welfare at scale. The atlas reveals that buildings aren’t just structures, they represent opportunity, resources, and how societies distribute their physical infrastructure.
3D Data Powers Climate Science
Buildings consume enormous amounts of energy for heating, cooling, and lighting, making them crucial to understanding climate change. The GlobalBuildingAtlas enables climate scientists to estimate heating and cooling demands, urban heat island intensity, and shading patterns with unprecedented accuracy. With approximate volumes and forms mapped globally, researchers can model how different neighborhoods will respond to rising temperatures and extreme weather.
A tightly packed slum with small buildings and intense solar exposure will experience heat differently than a spacious district with tall structures and shade. Understanding these local variations is essential for adapting cities to climate change.
UN Sustainable Development
The atlas directly supports implementation of UN Sustainable Development Goals by providing detailed spatial indicators for housing, basic services, and resilient infrastructure. Detailed building distributions help assess informal settlements and monitor progress on safe housing targets.
Planners can identify where water, electricity, and transportation networks are most needed. The data reveals gaps between existing infrastructure and population distribution, guiding investments toward maximum impact. For Goal 11 (Sustainable Cities and Communities), the atlas is invaluable. It enables planners to measure progress toward inclusive urbanization, equitable housing access, and resilient infrastructure.
Predicting Risk and Saving Lives
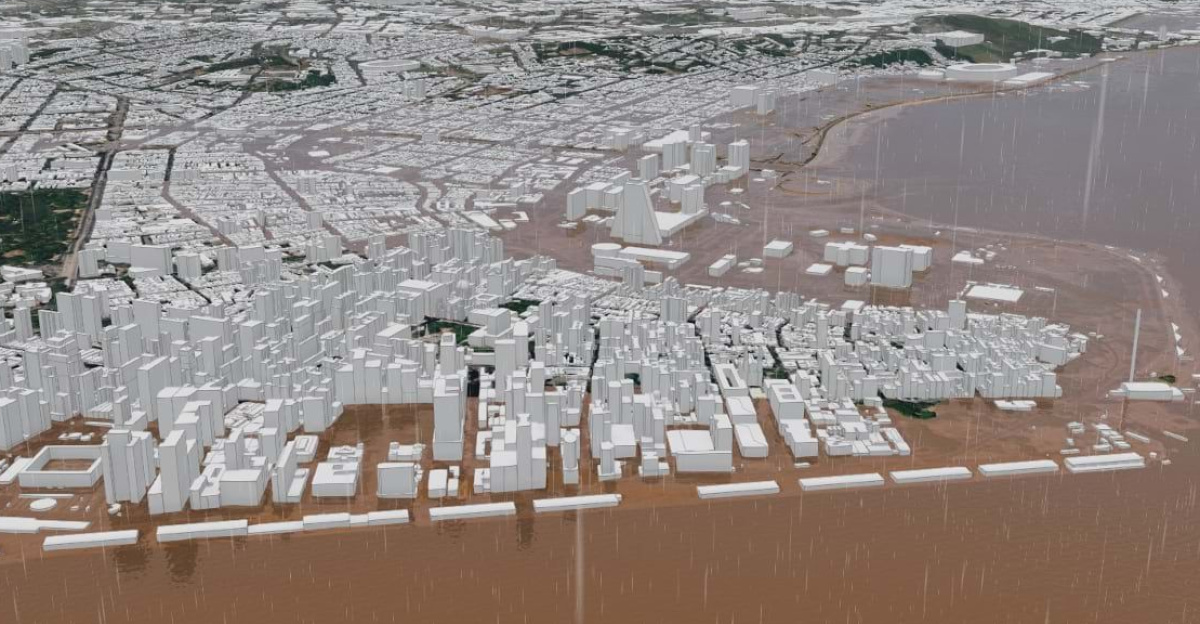
Disaster agencies can overlay hazard maps, flood zones, earthquake fault lines, cyclone tracks, onto 3D building layers to estimate exposure. How many structures and people face risk? How severe could damage be? Where should protective infrastructure be prioritized?
The atlas enables realistic simulations of potential disasters, transforming theoretical hazards into concrete risk assessments. Emergency planners can identify neighborhoods most vulnerable to floods, design evacuation routes, and calculate emergency shelter capacity. When disasters strike, response teams can access ready-made 3D building data to assess damage quickly and direct aid where it’s needed most.
Global Disaster Response Networks
The German Aerospace Center (DLR) is exploring how the GlobalBuildingAtlas integrates into the International Charter Space and Major Disasters, a global framework coordinating satellite support after catastrophes. When earthquakes, tsunamis, or floods strike, this international network mobilizes satellite imagery to assess damage.
Having pre-made 3D building data dramatically accelerates response. Instead of starting from scratch analyzing new satellite imagery, responders can quickly reference existing building distributions, identify impacted neighborhoods, and determine where aid is urgently needed.
Tracking Carbon

Buildings are responsible for roughly one-third of global energy consumption and associated carbon emissions. The GlobalBuildingAtlas enables researchers to estimate energy demands based on building volumes, climate conditions, and usage patterns. By combining this data with local climate and efficiency information, scientists can trace building-related CO2 emissions to specific areas and building types.
A dense downtown district with efficient multi-story buildings will have a different carbon profile than sprawling suburban single-family homes. This granular understanding supports targeted retrofits, efficiency standards, and low-carbon urban planning.
Planning Better Cities
Urban planners use the atlas to map current density, identify where infrastructure lags behind population growth, and test scenarios for transit corridors, utilities, and green spaces. Because the data is globally consistent, cities in different countries can be compared using identical metrics. A planner in Lagos can learn from Singapore’s density patterns.
Mumbai can reference Barcelona’s infrastructure approaches. This global benchmarking spreads best practices in compact, resilient, and equitable urban design. The atlas enables scenario planning and by answering these questions with real data, planners make better decisions that improve quality of life for millions of residents.
The Open Data Revolution
The GlobalBuildingAtlas is available as open data through platforms like GitHub and Google Earth Engine, enabling global adoption far beyond academic researchers. Governments access it for policy-making. Startups build commercial applications. NGOs use it for development planning. Citizen scientists experiment with innovative analyses.
This openness encourages creative applications researchers never anticipated. Disaster dashboards show real-time risk. Climate apps let communities plan adaptation strategies. Mobile tools help governments target infrastructure investment. By sharing this foundational data openly, the atlas multiplies its impact exponentially.
Sources
- TUM press release – All the world’s buildings available as 3D models for the first time
- GlobalBuildingAtlas GitHub repository (data and code)
- Global Building Atlas entry in the Earth Engine community catalog
- Scientific dataset paper in Earth System Science Data (building polygons and heights)
- Interesting Engineering article – high‑resolution 3D map of Earth’s buildings